
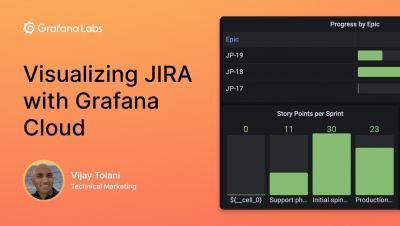

How to get One-click SCOM Root Cause Analysis
SCOM has incredible powers, but it’s not always easy to find the root cause of issues fast. And you definitely don’t get one-click SCOM root cause analysis. We’ve all been there. A business-critical server goes down and you don’t know why. Let’s imagine you had a dashboard showing the health statuses of all your server groups and you notice that the United States is showing as critical.

New in Grafana 9: The Prometheus query builder makes writing PromQL queries easier
When Grafana started in 2014, its main goal was to be a great dashboarding solution for Graphite. Around the same time, the Prometheus project started to gain steam, but it wasn’t clear whether it should be added to Grafana. After all, Grafana was a Graphite frontend, it was uncertain at the time if Prometheus would take off in popularity, and it would take resources away from the core purpose of why Grafana was created.
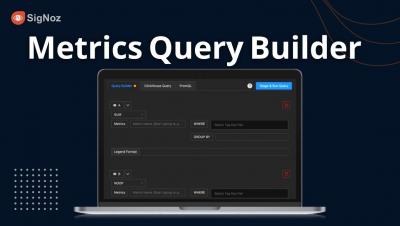
Metrics Query Builder to make Advanced and Custom Dashboards for your Application | SigNoz
In this video, Pranay Prateek (CEO, SigNoz, pranay@signoz.io) walks you through the basic functionality of Query Builder using Signoz followed by Srikant, one of our best software engineer at SigNoz shows us in detail of all the super useful and advanced features of Metrics Query Builder. Agenda of the video: Do checkout our other Instrumentation videos as well!

Is MetricFire An Alternative to Grafana?
In this article, we will talk about Graphite and Grafana monitoring systems, and their similarities and differences. Also, we will explain why it is an effective solution to use Graphite and Grafana together to monitor your system metrics. We will also learn about the benefits of using MetricFire. Sign up for MetricFire for free and store and process your system metrics with our hosted Graphite solution.

How real-time Grafana dashboards and alerts combat climate change: Inside Apeel Sciences observability stack
Meet the newest changemakers making an impact in the current climate crisis: Apeel Sciences. The ag-tech company is on a mission to eliminate the 8 percent of greenhouse gas emissions caused by global food waste with their edible, plant-derived food coating, which keeps fruits and vegetables fresh for up to twice as long.

Alerting in Grafana 9
For more info, go to:
Grafana Alerting page: https://grafana.com/grafana/grafana-alerting/
Grafana Alerting documentation: https://grafana.com/docs/grafana/latest/alerting/

How to create a Mimir managed alert rule in Grafana
For more info, go to:
Grafana Alerting page: https://grafana.com/grafana/grafana-alerting/
Grafana Alerting documentation: https://grafana.com/docs/grafana/latest/alerting/

How to create an alert in Grafana
For more info, go to:
Grafana Alerting page: https://grafana.com/grafana/grafana-alerting/
Grafana Alerting documentation: https://grafana.com/docs/grafana/latest/alerting/

How to build a dashboard for AppDynamics
We’re excited to announce that we’ve just released SquaredUp Dashboard Server 5.6! This Dashboard Server release covers multiple features that have been highly requested by the community. Prioritizing this user feedback, we’ve added some exciting new visualizations, features and enhancements. Read on to learn about the latest updates, or catch the full webinar recording at the bottom of the blog for a detailed demo by Senior Solutions Engineer Ashley Thompson.