Operations | Monitoring | ITSM | DevOps | Cloud
Analytics
Matplotlib Tutorial - Learn How to Visualize Time Series Data With Matplotlib and InfluxDB
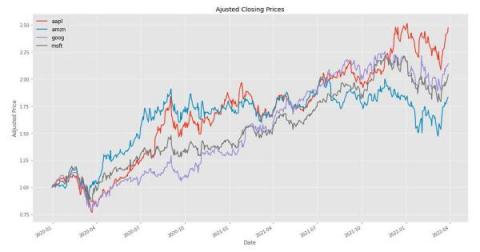
A time series is a sequence of data points (observations) arranged chronologically and spaced equally in time. Some notable examples of time series data are stock prices, a record of annual rainfall, or the number of customers using a bike sharing app daily. Time series data exhibits certain patterns, such as the highs and lows of hotel prices depending on season.
Cloud Cost Dashboard Demo
Cloud Savings Recommendations Demo
How IT Operations can demonstrate business value with Unified Analytics
As an IT Ops exec, imagine your jubilation upon learning that after a year of hard work across your NOC, DevOps and SRE teams, you are able to automate incident response by 25%. You’re elated as you enter your CTO’s office to share this information, and their response is.
Multicloud Cost Management
More enterprises are adopting cloud computing to ensure that they can accelerate innovation, stay competitive, and enjoy cost savings. This trend has only increased in the last two years with the rise of remote work necessitated by the COVID-19 pandemic. With the rise of cloud adoption, multi-cloud and hybrid cloud deployments are increasing in popularity as well. According to a Gartner survey, 81% of survey respondents are using two or more cloud providers.
Getting Started with OpenTelemetry for Observability
This article was published in The New Stack. For most developers, software development means there is an API for almost everything, hardware is provisioned via the cloud and the core focus is on building only the features most crucial to your business. Of course, all these integrations and modern distributed architectures create their own set of problems. Having full insight into your application has become even more important and is now commonly known as observability.
Introducing the new and improved Grafana BigQuery plugin
We are happy to announce that an official Google BigQuery data source plugin for Grafana has arrived! Based on the popular DoiT International BigQuery DataSource community plugin, the new Grafana BigQuery plugin brings a new and improved query editor experience plus support for all BigQuery data types, Grafana Alerting, and query caching.
Five worthy reads: Generative AI, an art or a growing concern?
Five worthy reads is a regular column on five noteworthy items we’ve discovered while researching trending and timeless topics. This week, we explore the concept of Generative AI.


