Operations | Monitoring | ITSM | DevOps | Cloud
Aiven is connecting streaming data with the Google BigQuery ecosystem
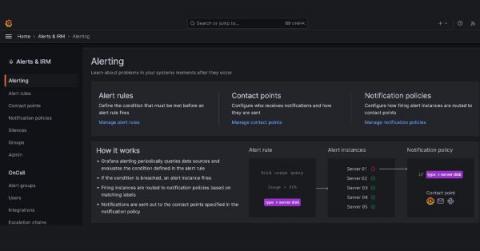
Alerting with Grafana and InfluxDB Cloud Serverless
Combining these two platforms provides an efficient, scalable and customizable tool for real-time data monitoring and alerting. In the data analytics and visualization world, it is crucial to have a system that not only effectively monitors your data, but can also alert you about any potential discrepancies or anomalies that may arise. One powerful tool set that enables you to monitor and alert on time series data is Grafana and InfluxDB Cloud Serverless.
How Pepperdata Capacity Optimizer Next Gen Can Save 30% Off Your Cloud Bill
How Technology Empowers Engineering Companies for Success
Data at the edge: Meet modern data processing demands with edge computing
We’ve all experienced latency in some form. It’s unfortunately something we’re all too familiar with. We’ve even gone so far as to accept it as a regular albeit undesirable part of the user experience. Yet despite various steps taken over the years, it still exists and is as disruptive as ever.
2023 Cloud Cost Management Platforms: A FinOps Tools Competitive Analysis
Managing cloud costs has become a must for FinOps-focused businesses. Gotta keep a close eye on those expenses! So, what is the best way to do it? Find a platform that can help you get cost visibility and catch any cloud costs anomalies before they turn into a money waste! With tons of FinOps tools, how do you figure out which one suits your needs? And what exactly should you be looking at? We get it! There’s much to consider when picking the best platform to get those cloud cost insights.
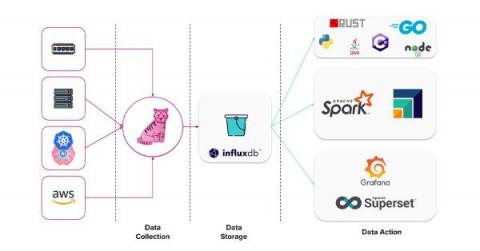
Infrastructure Monitoring Basics with Telegraf, InfluxDB, and Grafana
Earlier this year, I had the pleasure of speaking at the Open Source Summit North America. When choosing a topic, I felt it was time to return to our roots and discuss the subject that originally put InfluxDB on the map: infrastructure monitoring. What was especially exciting was the opportunity to showcase the new capabilities of InfluxDB 3.0 to the open source community and explain their significance for the future of infrastructure monitoring use cases.
How to Simplify Complex Information for a Website Audience
12 Best Application Performance Monitoring (APM) Tools
In today’s fast-paced world, applications are vital for driving businesses forward. However, without proper monitoring and insights into your application’s performance, you can’t identify what causes slow response times, high CPU usage, or database bottlenecks. But with an Application Performance Monitoring (APM) tool, you can gain deep visibility into your application’s performance by tracking critical metrics.


