Operations | Monitoring | ITSM | DevOps | Cloud
Blog
Boost HTTP Client Monitoring in Elixir with AppSignal and Tesla Templates
When relying on data from external services, it's important for the retrieval to be accurate and timely. While we may not control how efficiently an external API responds to our requests, we can control how and when we request data from that API. However, over time as your application and the API that serves it change, once efficient requests may turn into bottlenecks.
How to capture custom metrics without app code changes using the Java Agent Plugin
The Elastic APM Java Agent automatically tracks many metrics, including those that are generated through Micrometer or the OpenTelemetry Metrics API. So if your application (or the libraries it includes) already exposes metrics from one of those APIs, installing the Elastic APM Java Agent is the only step required to capture them. You'll be able to visualize and configure thresholds, alerts, and anomaly detection — and anything else you want to use them for!
Azure Unit Cost Analysis for Cloud cost optimization
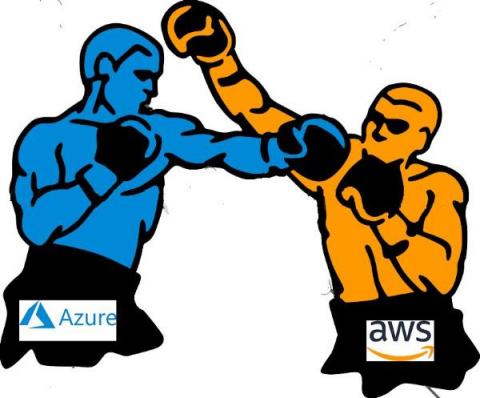
Microsoft Azure vs AWS
Welcome to the fascinating world of cloud computing! As you traverse this realm, you’re bound to encounter two behemoths, Microsoft Azure and Amazon Web Services (AWS). Each champion in their own right, these two platforms dominate the landscape, offering a myriad of solutions that are designed to propel businesses to greater heights. But, as with most things in life, you’re bound to question which is the better choice for your specific needs.
Moving Massive Amounts of Data into Google Chronicle? Cribl Stream Makes it A Piece of Cake
As someone who admittedly gets bored easily, one of my favorite things about working for a company like Cribl is the huge amount of technologies in our ecosystem I get exposure to. Over time, I also get to observe trends in the market – it’s always so cool to see big upswings in adoption for various platforms and tech. One such trend I’ve observed over the last year is a noticeable uptake and presence in the market of Google Chronicle.
Python Logging Best Practices: The Ultimate Guide
Python is a highly skilled language with a large developer community, which is essential in data science, machine learning, embedded applications, and back-end web and cloud applications. And logging is critical to understanding software behavior in Python. Once logs are in place, log monitoring can be utilized to make sense of what is happening in the software. Python includes several logging libraries that create and direct logs to their assigned targets.
VMware Tanzu Aligns to Multi-Cloud Industry Trends
Businesses today are prioritizing software agility to remain competitive in a rapidly changing world. However, the perks of having access to different clouds, tools, and methodologies can also bring along with it layers of complexity. As the cloud native landscape continues to grow, it’s vital that organizations are investing in capabilities that accelerate developer productivity, drive revenue, and maintain a competitive edge.
8 GKE Monitoring Best Practices To Apply ASAP
Trusted Types: How we mitigate XSS threats in Grafana 10
Grafana is a rich platform for data visualization, giving you full control over how your data should be visualized. However, this flexibility and freedom comes with some challenges from a security perspective — challenges that need to be solved to protect the data in Grafana. For years, cross-site scripting (XSS) has been among the most common web application security vulnerabilities.


