Developers, take command of your deploys
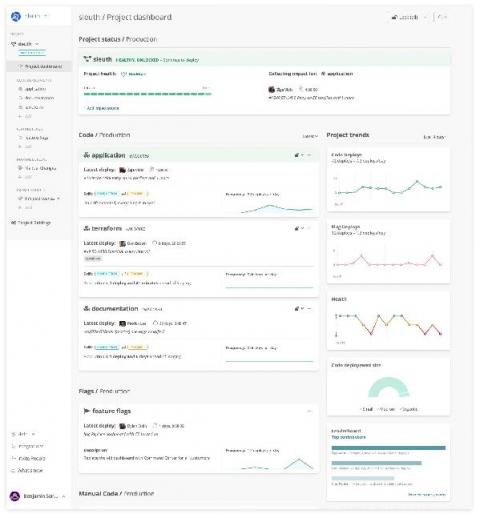
Today we’re excited to be rolling out a completely redesigned Sleuth experience. Our new Command Center provides one place to visit so developers can quickly and safely deploy new changes.


Today we’re excited to be rolling out a completely redesigned Sleuth experience. Our new Command Center provides one place to visit so developers can quickly and safely deploy new changes.
We often hear that our customers love using Splunk, know the power behind our platform and want to expand usage to IT. But they aren’t sure what steps to take first. We want our customers to maximize their Splunk investment and get them jump-started with Splunk for IT use cases by providing the guidance and best practices they seek.
It’s January 2021 and you’ve probably broken five out of six New Year’s Resolutions. I don’t want to be the reason for breaking your last one, so I’ll cut right to the chase. We just released an update to our JavaScript SDK with the ability to track the health of your releases and support for Web Assembly. Still with me? Great.
Incidents are inevitable, and the reality is some of them are inevitably going to repeat themselves. FireHydrant has always strived to make the entire incident response lifecycle smooth, but up until today, common incident types were slightly burdensome for our customers. We decided it was time to help people make it easy to declare incidents using easy-to-use templates, which we’re deeming Incident types.
We’re happy to announce the release of AppSignal for Elixir 2.1.0. 🥳 In this version, we’ve made our error helpers more flexible than before. You could already send Elixir exceptions directly through AppSignal and now you can add extra metadata to errors when using send_error/2-4. Let’s go through all of the changes 😀
Welcome to another monthly update on what’s new from Sysdig. Our team continues to work hard to bring great new features to all of our customers, automatically and for free!
Today’s announcement of Longhorn 1.1, a Cloud Native Computing Foundation (CNCF) Sandbox project, is exciting news for users of Rancher, SUSE’s Kubernetes management platform, and the Kubernetes community. Longhorn is an enterprise-grade, cloud native container storage solution that went GA in June 2020. Since then, adoption has increased by 235 percent.
Our New Year’s resolution is to continue to improve the legendary cross-platform GitKraken Git GUI, and we’re starting off with a bang. 🎉 We bring you, GitKraken v7.5.
We’ve released version 1.5 of the HAProxy Kubernetes Ingress Controller. This version unlocks access to the raw HAProxy configuration language for power users to gain more control. You can also enable mutual TLS authentication between the ingress controller and services, enforce Basic authentication, and return custom error pages to users.


