Operations | Monitoring | ITSM | DevOps | Cloud

Monitoring

The latest News and Information on Monitoring for Websites, Applications, APIs, Infrastructure, and other technologies.

The Hidden Danger of Websites Relying on Third Party Software: A Case Study with 5 Key Takeaways

Using third party software on websites comes with risk and reward. eCommerce sites and platforms typically rely on the integration of a significant number of third-party apps and tools to augment functionality and features, from extracting customer data for personalization to enabling live chat to analyzing user experience of changes to a site. While third parties are often invaluable for these kinds of interactive purposes, they can also be the cause of disruptions to user experience.

DIY SD-WAN vs. Managed SD-WAN

Software-Defined Wide Area Network (SD-WAN) is a network architecture that provides organizations with a flexible, secure, and cost-effective way to manage their networks. SD-WAN technology abstracts the underlying network and provides an intelligent layer of abstraction, making it possible to manage network traffic and dynamically control the flow of data. SD-WAN technology is an attractive option for organizations looking to improve the performance and security of their networks.

Kubernetes Architecture Part 3: Data Plane Components

This Kubernetes Architecture series covers the main components used in Kubernetes and provides an introduction to Kubernetes architecture. After reading these blogs, you’ll have a much deeper understanding of the main reasons for choosing Kubernetes as well as the main components that are involved when you start running applications on Kubernetes.

PromQL Cheat Sheet: A Quick Guide to Prometheus Query Language

Prometheus is an open-source monitoring and alerting toolkit that has gained significant popularity in DevOps and systems monitoring. At the core of Prometheus lies PromQL (Prometheus Query Language), a powerful and flexible query language used to extract valuable insights from the collected metrics. In this guide, we will explore the basics of PromQL and provide query examples for an example use case.

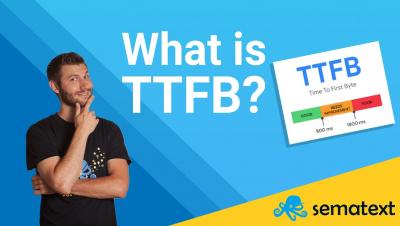
What is TTFB? | Time to first Byte Explained

This video delves into the crucial topic of Time to First Byte (TTFB). Time to First Byte is a vital metric that measures the duration it takes for a user's browser to receive the first byte of data from a web server. By understanding TTFB, you gain valuable insights into the responsiveness and efficiency of your website. Sematext's monitoring tool empowers you to accurately measure and track TTFB across multiple sites without needing local installations.

What is Grafana Scenes? - with Torkel Ödegaard, creator of Grafana (Grafana Office Hours #02)

In GrafanaCON 2023, the latest version of Grafana 10 was announced, and with it, Scenes. But what is Grafana Scenes? Torkel Ödegaard, creator of Grafana and co-founder of Grafana Labs, joins Senior Developer Advocate Nicole van der Hoeven to discuss what Scenes is and how you can use it to create dynamic dashboards like never before.

Don't Let Observability Inflate Your Cloud Costs

We saw a shift this year in how the technology sector honed in on sustainability from a cost perspective. In particular, looking at where they’re spending that revenue in the infrastructure and tooling space. Observability tooling comes under a lot of scrutiny as it’s perceived as a large cost center—and one that could be cut without affecting revenue. After all, if the business hasn’t had a problem in the last few months, we mustn’t need monitoring—right?

Grafana 10 release: New panels, Grafana as code updates, data correlations, and more

We are beyond thrilled to announce the arrival of Grafana 10, which was highlighted during the GrafanaCON 2023 keynote. The latest major release of the popular visualization and monitoring tool, which now has more than 20 million users around the world, is not just about introducing new features. Grafana 10 is also about enabling you to achieve more — more analysis, more collaboration, more insights, more efficiency and, of course, more beautiful dashboards. Grafana: download now!