Operations | Monitoring | ITSM | DevOps | Cloud

Monitoring

The latest News and Information on Monitoring for Websites, Applications, APIs, Infrastructure, and other technologies.

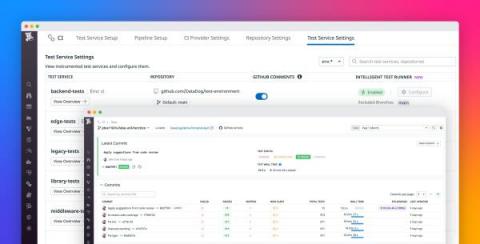
Streamline your CI testing with Datadog Intelligent Test Runner

Modern continuous integration (CI) practices enable development teams to quickly and efficiently build and deploy application code to a shared codebase. However, deploying new code is typically accompanied by tests, and as the codebase expands, this results in a proportionately larger test suite.

Unraveling the Log Data Explosion: New Market Research Shows Trends and Challenges

Log data is the most fundamental information unit in our XOps world. It provides a record of every important event. Modern log analysis tools help centralize these logs across all our systems. Log analytics helps engineers understand system behavior, enabling them to search for and pinpoint problems. These tools offer dashboarding capabilities and high-level metrics for system health. Additionally, they can alert us when problems arise.

Intro to InfluxDB 3.0

We took the leading time series database and rebuilt it from the ground-up to make it better than ever. InfluxDB 3.0 delivers new features and capabilities, significant performance improvements, and native SQL support to expand and extend time series use cases that rely on high-cardinality time series data for observability, real-time analytics, and IoT/IIoT/Operations Technology.

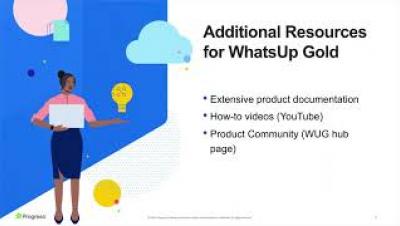
Ask Me Anything: WhatsUp Gold Performance Monitors Webinar

WhatsUp Gold includes three types of monitors: active, passive and performance. Performance monitors are extremely helpful for proactively preventing potential problems, such as disk space running low or memory usage running higher than expected. Watch this webinar to learn best practices for creating and using performance monitors.

A Step-by-Step Guide to Standardizing Telemetry with the BindPlane Observability Pipeline

Adding additional attributes to your telemetry not only provides valuable context to your observability pipeline but also enhances the flexibility and precision of your data operations. Consider, for example, the need to route data from specific geographical locations, like the EU, to a designated destination. With a ‘Location’ attribute added to your logs, you can seamlessly achieve this.

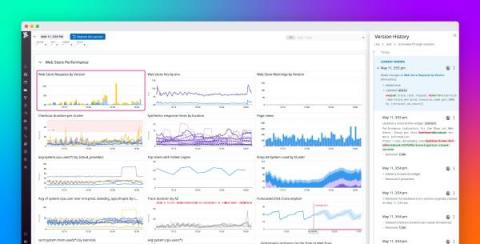
Track changes to Datadog dashboards and notebooks with version history

Datadog dashboards and notebooks can be powerful tools for troubleshooting, enabling you to analyze telemetry from across your stack with visualizations customized by service owners, data analysts, and engineers. Many organizations also rely on dashboards and notebooks for key business processes, such as generating reports, creating postmortems, and managing SLOs. This makes it important to keep track of any unintended changes that may result from others accessing your content.

Mastering AWS Fargate pricing and optimization with CloudSpend: A comprehensive guide

AWS Fargate is a powerful tool for running containerized workloads on AWS. It’s a serverless compute engine that allows you to run containers and focus on developing and deploying your applications while AWS controls the cloud infrastructure. This can make a real difference for an organization, saving both time and resources that would otherwise go towards managing servers. This guide will discuss AWS Fargate pricing and provide tips for cost optimization.

Achieve operational resilience with a flexible data store

Are you prepared for the unexpected? In today's rapidly evolving world, operational resilience has never been more critical for businesses to survive and thrive. Resiliency is the ability of a system to maintain its operations under adverse conditions, including system failures, unexpected surges in user demand, or even security breaches. The heart of many applications, particularly in this era of data-driven decision-making, is the data store or database.