Operations | Monitoring | ITSM | DevOps | Cloud

The latest News and Information on Monitoring for Websites, Applications, APIs, Infrastructure, and other technologies.

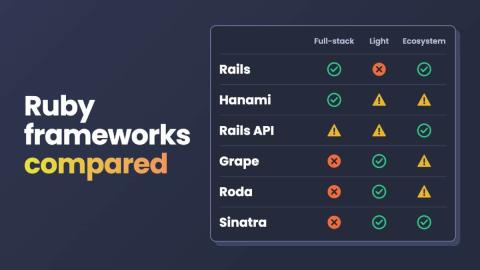
Which Ruby Framework is Best? Use This Decision Tree

Search "best Ruby frameworks" and Google will give you a dozen posts that all say the same thing: a table ranking Rails, Sinatra, Hanami, Grape, and Roda, followed by a paragraph on each. None of them tell you which one to use for your project. That's because a ranking doesn't fit this problem. These frameworks aren't better or worse versions of each other. They're built for different jobs. Rails optimizes for full-stack productivity. Hanami optimizes for architectural boundaries.
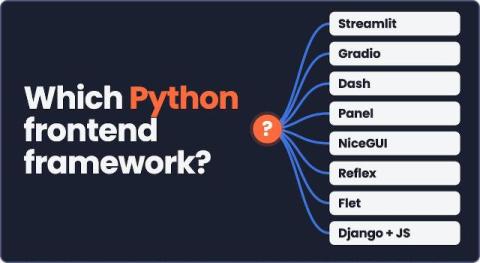
Which Python Frontend Framework Is Best? Use This Decision Tree

Search "best Python frontend framework" on Google and you'll get the same page over and over: a listicle ranking Streamlit, Gradio, Dash, NiceGUI, Reflex, and Flet, followed by a paragraph on each and a score out of ten that doesn't mean anything. None of them tell you which one to use for your project.

How to Monitor an Ubuntu Server (Step by Step)

Summarize with ChatGPT Claude To monitor an Ubuntu server, watch seven things: CPU, load average, memory, disk space, disk I/O, network and whether the machine is up at all. You can check all of them in under a minute with commands that ship with Ubuntu (top, free, df, vmstat) plus iostat from the sysstat package. That is fine while you are logged in.

How to Get Alerted When a Server Goes Down (Email, SMS, Call)

Summarize with ChatGPT Claude To get alerted when a server goes down, run a check from outside the server and send its result to a channel that reaches a human. That check can be a cron script on a second machine that pings the host and tests a port, an external ping or TCP port monitor, or an agent on the server whose silence opens an incident. Email and Slack are fine for the record. For a server that matters at 3am, the alert has to escalate to SMS and then a phone call when nobody acknowledges it.

Why Is GPU Utilization Low During AI Training? 6 Bottlenecks to Check

You bought the GPUs to make AI training faster. So why are they sitting idle? When GPU utilization drops during a training run, the obvious answer is to blame the accelerator. Maybe the workload is too small. Maybe the GPU isn't powerful enough. Maybe it's time to add more hardware. But what if the GPU isn't the problem at all? A training workload is only as fast as the infrastructure feeding it.

Hyperping MCP: Run Incidents, Status Pages and Maintenance

Summarize with ChatGPT Claude The Hyperping MCP server now has 49 tools: 28 that read and 21 that write. An agent connected from Claude Code, Cursor, Codex or another MCP client could already manage monitors, publish a status page incident and schedule maintenance. It can now do most of the rest: declare an incident and page on-call, acknowledge and escalate it, correct what was posted on the status page, create and configure status pages, and reschedule, end or cancel maintenance.

Autonomous IT operations: Scaling business without scaling IT complexity

Autonomous IT operations use AI, operational data, observability, and automation to enable IT environments to detect issues, understand their context, determine the appropriate response, and act with minimal human intervention. As businesses grow, IT environments rarely stay simple. More employees, endpoints, applications, and cloud services generate even more alerts, incidents, and operational work. The traditional model scales linearly: more environment means more manual effort.

Grafana Campfire - What's New in Grafana Git Sync - (Grafana Community Call - Sept 2026)

Join us for a follow-up Grafana Campfire to explore what we’ve built in Git Sync since December 2025. We’ll cover new and improved Git provider integrations and authentication options, smoother dashboard editing and pull request workflows, and more control over changes through signed commits, user attribution, and PR and commit conventions. We’ll also explore improvements to folder organization and permissions, READMEs alongside your dashboards, and clearer synchronization status.