Operations | Monitoring | ITSM | DevOps | Cloud

Monitoring

The latest News and Information on Monitoring for Websites, Applications, APIs, Infrastructure, and other technologies.

Revolutionizing call center management: The power of Full-Stack Observability with UCCE/PCCE

Full-stack observability with Cisco AppDynamics revolutionizes call center management, optimizing performance, improving customer experience and driving business success. Full-stack observability has revolutionized call center management by integrating Cisco AppDynamics into Cisco Unified Contact Center Enterprise (UCCE). Let’s explore the value of UCCE monitoring and its ability to deliver exceptional customer experiences.

Getting started with AWS CloudWatch

Out of more than 100 services that Amazon Web Services (AWS) provides, Amazon CloudWatch was one of the earliest services provided by AWS. CloudWatch was announced on May 17th, 2009, and it was the 7th service released after S3, SQS, SimpleDB, EBS, EC2, and EMR. AWS CloudWatch is a suite of tools that encompasses a wide range of cloud resources, including collecting logs and metrics; monitoring; visualization and alerting; and automated action in response to operational health changes.

Dashboard Stories: High-level Jira ticket summary

Luke Gackle, ICT Service Desk Officer at the South Australian Tourism Commission presents this Jira Ticket Summary dashboard built in SquaredUp using the Jira plugin. Built to provide his support team an at-a-glance view of ticket statuses nearing an SLA breach, it now serves as as key overview / reference point for their daily stand-ups. With no good way of displaying these numbers in a native Jira dashboard, Luke used the Jira plugin to effortlessly fill these gaps in a SquaredUp dashboard.

Anything But Tech Debt

Tech debt is usually one of the most fraught topics on engineering teams. Engineers often feel they aren’t allowed enough time to address tech debt. Product partners wonder why engineers spend so much time working on it—or at least talking about it. “The business” always seems to insinuate that engineers should do less of it, instead focusing on shipping value to customers.

Dashboard Stories: A unified view of NSW snowboarding conditions

Adam Hewins, Senior Operational Support Engineer, presents this cool snowboarding conditions dashboard built in SquaredUp using the WebAPI plugin. As a long-time snowboarder, this dashboard was built so Adam can see at-a-glance the weather and trail conditions in Perisher, NSW. Learn how Adam used the WebAPI plugin to effortlessly surface data for snowfall, snowdepth, temperature and even Perisher live camera imagery in one centralized dashboard.

BindPlane Agent Resiliency

A quick video about the resiliency of your BindPlane agent showing the parameters to tweak on destinations and best collector architecture to ensure you're not losing any data. About ObservIQ: observIQ brings clarity and control to our customer's existing observability chaos. How? Through an observability pipeline: a fast, powerful and intuitive orchestration engine built for the modern observability team. Our product is designed to help teams significantly reduce cost, simplify collection, and standardize their observability data.

Troubleshooting ECS Container Crashes

Amazon Elastic Container Service (ECS) is a versatile platform that enables developers to build scalable and resilient applications using containers. However, containerized services, like Node.js applications, may face challenges like memory leaks, which can result in container crashes. In this blog post, we’ll delve into the process of identifying and addressing memory leaks in Node.js containers running on ECS. First, let’s look closer at what a memory leak is.

Send your logs to multiple destinations with Datadog's managed Log Pipelines and Observability Pipelines

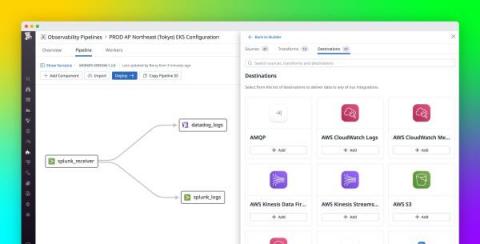
As your infrastructure and applications scale, so does the volume of your observability data. Managing a growing suite of tooling while balancing the need to mitigate costs, avoid vendor lock-in, and maintain data quality across an organization is becoming increasingly complex. With a variety of installed agents, log forwarders, and storage tools, the mechanisms you use to collect, transform, and route data should be able to evolve and adjust to your growth and meet the unique needs of your team.