Operations | Monitoring | ITSM | DevOps | Cloud

Monitoring

The latest News and Information on Monitoring for Websites, Applications, APIs, Infrastructure, and other technologies.

Continuous Observability: Shedding Light on CI/CD Pipelines

DevOps is not just about operating software in production, but also releasing that software to production. Well-functioning continuous integration/continuous delivery (CI/CD) pipelines are critical for the business, and this calls for quality observability to ensure that Lead Time for Changes is kept short and that broken and flaky pipelines are quickly identified and remediated.

Splunk Edge Processor Enhancements Offer Greater Data Access and Improve Data Management

On the heels of an exciting GA in March and the April announcement of its regional expansion, we are excited to share the latest updates to Splunk Edge Processor that will make it even easier for customers to have more flexibility and control over just the data you want, nothing more nothing less.

Democratizing Data Through Secure Self-Service Concierge Access of Cribl Stream

Ah, the age-old question of how to manage screen time for kids – it’s like trying to navigate a minefield of Peppa Pig, Paw Patrol, and PJ Masks! I mean, who knew Octonauts and Bubble Guppies would become household names? As a dad of two young kids, managing screen time is a balancing act, especially keeping our 5-year-old happy with access to her shows.

Domain Driven Design For All

Domain Driven Design (DDD) is usually associated with microservice architectures. As microservice architectures have been perceived as burdensome and overly complex, so too have organizations started to call into question the relevance of DDD initiatives. The argument is usually that unless an organization reaches a mega-scale that requires eventing to keep and micro-services to scale horizontally, such architectures are overkill.

Four reasons to try our next-gen dashboards

When you need to troubleshoot faster, rich out-of-the-box content lets you easily monitor the tools in your technology stack. Dashboards are key to our customers’ success — offering you deep insights at a glance and the ability to drill into the details most important to you. A couple years ago, we debuted a new style of dashboards, built on top of a scalable, flexible and extensible charting system.

Cribl Stream Projects

The increasing demand for Cribl Stream as an internal service is a testament to its effectiveness in improving operations and enhancing security measures. With the rise of ITOps, SecOps, SRE, DevOps, and other teams embracing Cribl Stream, we are excited to offer Cribl Stream Projects, which enables the secure expansion of Stream usage to more users within organizations. This enhances collaboration and provides deeper insights, resulting in a more personalized user experience. With Stream Projects, Cribl is the first product in the industry enabling organizations to allow teams to manage their own data without needing to understand the infrastructure or service being used to collect and route it.

Monitoring to Ensure Optimal Developer Experience and Productivity

For Software Houses, developers are as important as customers are to a retail organization – if the Developer Experience (DX / DevExp / DevEx) is poor, then work simply will not get done effectively and the best and the brightest are likely to leave for an employer who offers a better experience and hence, more productivity and job satisfaction. Long-term frustrated employees and staff attrition tend to impact product quality and lead to weaker software applications.

Best Practices for Monitoring Kubernetes with Grafana

There are tons of tools to choose from when it comes to visualizing data, but Grafana has become one of the best ways for organizations to visualize information and get notified about events happening within their infrastructure or data. According to Kubernetes: In this article, we will take a look at the best practices for monitoring Kubernetes using Grafana.

Exciting Times for Monitoring as Code: A Nod from TWO Gartner Hype Cycles

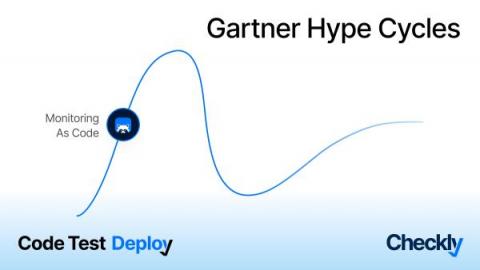
Earlier this week we shared some exciting news. Checkly has made its mark in not one, but two Gartner Hype Cycles reports. We're being recognized for something we're super passionate about - Monitoring as Code (MaC). This recognition comes in the Hype Cycle for Monitoring and Observability and the first ever Hype Cycle for Site Reliability Engineering. It's a big deal for us, and here's why it should matter to you, too.