The latest News and Information on Monitoring for Websites, Applications, APIs, Infrastructure, and other technologies.
Not all the waves we make are extreme. This is our fancy way of saying that we’ve been making a lot of small, behind the scenes updates lately targeting improvements to reporting and performance. For a full rundown, check out our release updates.
Logz.io has pressed hard to align our tracing and metrics analytics capabilities over the past year. And as our technology advances, so does our service. We are announcing Multiple Tracing Accounts with Logz.io Distributed Tracing, aligning it with our logging and metrics tools. Complementing multiple data sources for metrics and logs, Logz users can segment their data according to sources and teams for better organization.
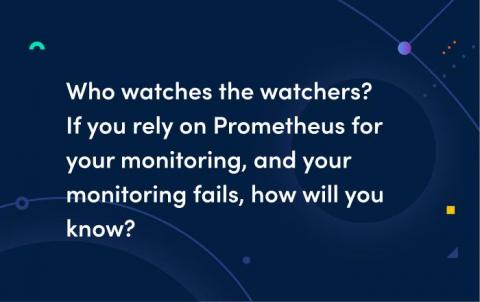
One of the big questions in monitoring can be summed up as: Who watches the watchers? If you rely on Prometheus for your monitoring, and your monitoring fails, how will you know? The answer is a concept known as metamonitoring. At Grafana Labs, a handful of geographically distributed metamonitoring Prometheus servers monitor all other Prometheus servers and each other cross-cluster, while their alerting chain is secured by a dead-man’s-switch-like mechanism.
Any production application needs to be monitored for its uptime. Let’s say you’ve developed a stock market statistics application, for example, using Spring Boot for your client. This application has to be up all the time while the stock market is open. If it’s down at a crucial time, it could mean huge losses for relevant stakeholders.