The latest News and Information on Monitoring for Websites, Applications, APIs, Infrastructure, and other technologies.
Networks are rapidly becoming larger and more complex, with numerous different technologies playing into their expansion. Network mapping is increasingly important for network administrators tasked with handling these growing networks. Network mapping provides network admins with a visual map so they can check network performance, the status of connected devices, monitor the network, and analyse networks before initiating troubleshooting efforts.
Monitoring the performance of server infrastructure is crucial to any organization. While metrics such as health and availability will sometimes suffice for measuring overall efficiency, getting visibility into more details, such as the underlying processes, tasks, and scheduled jobs, is often crucial for not just identifying a performance problem but also isolating its root cause.
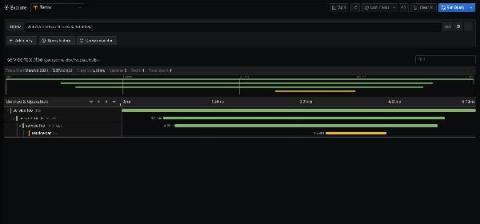
When investigating a complex system—or learning about it for the first time—you need to explore metrics, traces, logs, and other kinds of data. But as you navigate across different views of your data in dashboards, alert notifications, flame graphs, and so on, it can be hard to keep track of what you have already seen. When a potential issue comes up and time is tight, the last thing you need is to spend time remembering a crucial graph or finding the right browser tab.
For complete visibility into the performance of your applications, you need telemetry data—traces, metrics, and logs—that describes activity across your entire stack. But if you’re using multiple monitoring tools, your data can end up in silos, making it difficult to troubleshoot issues that affect your user experience.
During a re:Invent keynote on Dec. 15, Amazon announced its AWS Managed Service for Prometheus. The service is built using the CNCF’s Cortex project, the open source, horizontally scalable Prometheus-compatible project that I started with Julius Volz over four years ago. I’d like to take this opportunity to extend a warm welcome to the Prometheus-as-a-Service club! We think you’ve made a good choice choosing Cortex, and see this as a massive vote of confidence in the project.
Looking back at the unprecedented challenges we faced together in 2020, we’d like to extend our thanks to the community of people who have continued to work towards Netdata’s mission of simplifying monitoring and troubleshooting for everyone. Let’s review some of this year’s highlights.
Perspective is important; 20/20 to someone who has just completed an eye exam is good news, however, the experience of 2020 that the rest of us have been privy to was much less clear. Martello has navigated through the challenges brought on by a global pandemic by taking proactive measures, being flexible, pivoting quickly when necessary, and continuing to work together – albeit as a socially distant team.
Over the last several months, there have been a variety of service providers that have launched Managed Prometheus offerings. This is a testament to the rise in popularity of the Prometheus project, and how it’s becoming a de facto standard for metrics. The most recent announcement in the Managed Prometheus landscape came from AWS. During a re:Invent keynote on Dec. 15, Amazon announced its AWS Managed Service for Prometheus.