Operations | Monitoring | ITSM | DevOps | Cloud

The latest News and Information on Monitoring for Websites, Applications, APIs, Infrastructure, and other technologies.

How To - Monitor Your Email Service with Catchpoint

Today, we’re going to continue diving into Catchpoint’s wealth of synthetic tests with a brief overview of network protocols and a look at some helpful use cases specifically around monitoring your email service. I’ll be sharing a hands-on demo, illustrating how this data shows up in Catchpoint – focusing on a pair of protocol tests we’ll be running against our email service.

Cloud Data Retention & Analysis: Unlocking the Power of Your Data

Enterprise data growth is accelerating rapidly in 2021, challenging organizations to adopt cloud data retention strategies that maximize the value of data and fulfill compliance needs while minimizing costs. To meet this challenge, organizations are adopting or refining their cloud data retention strategies. In this blog post, we’ll take a closer look at the state of data retention and analytics in the cloud.

Why you should use Central Error Logging Services

Logs are vital for every application that runs in a server environment. Logs provide essential information which points to whether the current system is operating properly. Looking through logs, you will gather data on system issues, errors, and trends. However, it is not feasible to manually look up errors on various servers across thousands of log files. The solution? Central errors logging services.

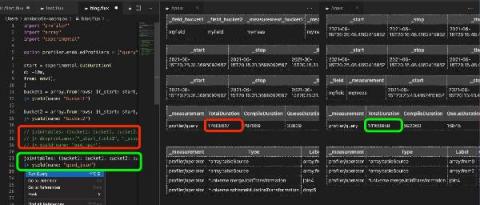
The Future of InfluxDB OSS: More Open, Permissive with Complementary Closed Source

I was recently on the Changelog Podcast talking about Elastic’s recent change away from open source licensing. I’m at 1:02:45 to 1:24:03, but the whole thing is pretty interesting if you have time to listen. This is where #InfluxDB is headed. No more open core, we're going to a combination of cloud offering, or if on-premise, a complementary offering to the open source. It'll take us time to get there, but that's the vision. Commercial complements the open source rather than replace.

How to monitor your API in just 2 simple steps?

In this video, you’re going to learn exactly how to monitor your API in just 2 simple steps! To be clear: Monitoring an API is a lot of hassle. But with this video tutorial, you’ll know how you can monitor your API in just 2 simple steps while saving a lot of time. Think of Components like folders that contain other Fyipe resources and one of the resources it has is called "Monitors". An API monitor will basically test your API to gain visibility into performance, availability, and functional correctness.

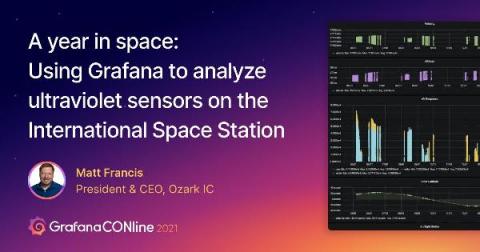
Troubleshoot problems using GitLab activity data with the new plugin for Grafana

GitLab is one of the most popular web-based DevOps life-cycle tools in the world, used by millions as a Git-repository manager and for issue tracking, continuous integration, and deployment purposes. Today, we’re pleased to announce the first beta release of the GitLab data source plugin, which is intended to help users find interesting insights from their GitLab activity data.

Guest Blog: Airbrake & LogicMonitor = Awesome News

“On Tuesday, we announced some big news: LogicMonitor has acquired Airbrake — a developer-centric application error and performance monitoring platform. This acquisition represents the latest step in our company’s journey towards becoming an end-to-end infrastructure monitoring and observability platform. As part of the acquisition, I am thrilled to welcome the Airbrake team into the fold!

Frequently Asked Questions | Vol 2

In an industry where technological evolution is commonplace, it’s easy to get lost in a sea of terminology and acronyms. It’s important to establish a solid foundation of understanding. In the second installment of our ‘Frequently Asked Questions’ series, we tackle issues related to effective monitoring, speed, and performance related to Microsoft 365 services.