Operations | Monitoring | ITSM | DevOps | Cloud

The latest News and Information on Monitoring for Websites, Applications, APIs, Infrastructure, and other technologies.

Webinar Recap: Force Multiply Your Security Operations Teams with Cribl LogStream

We hosted a webinar a few weeks back on using Cribl LogStream to make your security operations more scalable, efficient, and cost-effective. The turnout was fantastic and, while we answered most of the audience’s questions live, we couldn’t get to all of them. So I’ll go through the questions we couldn’t get to and offer some answers. Along the way, I’ll also share the results of two polling questions we asked during the webinar.

Launching a labor of love, Kentik Market Intelligence

When it comes to the internet, understanding the global ecosystem can be tough. There’s a lot of manual work that service providers and digital businesses have traditionally put into finding the best way to reach customers over IP networks. And more work is needed for benchmarking against competitors and finding the best relationships for peering.

Logstash: Path to ECS for 8.0

The Elastic Common Schema is a community-driven effort to provide consistent semantic meaning to datasets so that data from disparate sources can be meaningfully used together. In Logstash 8.0, ECS compatibility is on-by-default — this is a pretty major change to how many plugins operate. In this talk, we outline the rationale behind the transition and also highlight how to opt-OUT of the transition with a simple pipeline setting.

Bootstrapping a cloud native multi-data center observability stack

Bram Vogelaar is a DevOps Cloud Engineer at The Factory, and he recently delivered an intro to observability talk during our Grafana Labs' EMEA meetup. When I talk to customers, they might tell me about how their applications are running in two data centers, but when we probe a little further, it turns out that their observability stack is only available in one of them. This revelation hit close to home last March.

Usual Performance Suspects: Introducing Suspect Spans

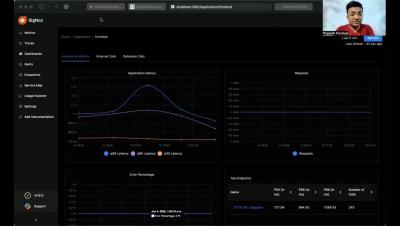
A trace is the end-to-end journey of one or more connected spans and a span is an operation or “work” taking place on a service. So when it comes to debugging a performance issue, being able to pick out slow spans out of a line up is the fastest way to seeing the root cause and knowing how to solve it. Suspect Spans surfaces a list of spans that correspond to where the most time in a transaction is spent.

SCOM Notifications: Kill your legacy email subscriptions in favor of Microsoft Teams

Microsoft Teams is a product that already before the pandemic started to gain popularity and, during, helped employees communicate and collaborate in their new remote offices. There are precursors to Teams - in Microsoft's portfolio, Skype for Business was retired last year, and after that, the increase of Teams users have been skyrocketing. Why Teams differ from some of the other communication alternatives is the many functions of teams that allow for much more than a chat, call, or virtual meeting.