Announcing AWS Lambda Telemetry API Support for Sysdig Monitor
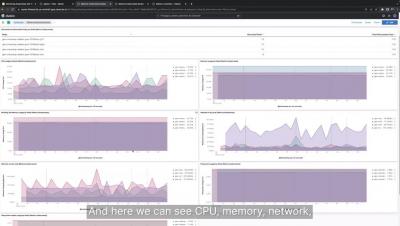
Observability in serverless computing environments, such as AWS Lambda, has always been a challenge.


The latest News and Information on Monitoring for Websites, Applications, APIs, Infrastructure, and other technologies.
Observability in serverless computing environments, such as AWS Lambda, has always been a challenge.
In 2021, we partnered with AWS to develop the Datadog Lambda extension which provides a simple, cost-effective way for teams to collect traces, logs, custom metrics, and enhanced metrics from Lambda functions and submit them to Datadog.
If you’re an engineer trying to fix real problems with your apps, looking at just one small part of the picture isn’t going to cut it. This is why Kentik is so focused on helping you understand what’s going on beyond single k8s instances, and it’s a big part of what network observability is all about. This was Kentik’s message at Kubecon 2022, which was a memorable event for us.
A lot of organizations are using Grafana to visualize information and get notified about events happening within their infrastructure or data. In this article, we will show how to create and configure Grafana Alert rules. To get started, log in to the MetricFire free trial, where you can send metrics and make Grafana dashboards right on our platform.
Using Sumo Logic, you can analyze both metrics and logs simultaneously. Developed in 2010, this solution provides a powerful query language and scheduling support. Sumo Logic's production monitoring features provide visibility into production issues. Instead of manually writing alerts, the platform offers pre-configured alert templates (which Logit.io also offers), which makes setting up alerts easier and faster.
In this post, I want to scratch at the surface of a very interesting technology that Elastic’s Universal Profiler and Security solution both use called eBPF and explain why it is a critically important technology for modern observability. I’ll talk a little bit about how it works and how it can be used to create powerful monitoring solutions — and dream up ways eBPF could be used in the future for observability use cases.