Best SRE Practices to Help Developers Troubleshoot Kubernetes
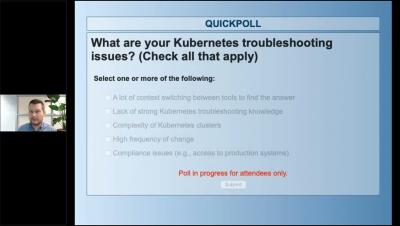
With the adoption of Kubernetes rapidly accelerating, many companies struggle with having the right skills within development teams to troubleshoot incidents quickly. Remediation of issues is of the greatest importance to avoid customer disruption. This webinar will introduce several best practices where SREs can take a leadership role, such as: Watch this webinar on-demand to learn how the SRE role can enable development teams to troubleshoot Kubernetes issues quickly and effectively.