
Operations | Monitoring | ITSM | DevOps | Cloud

The latest News and Information on Monitoring for Websites, Applications, APIs, Infrastructure, and other technologies.

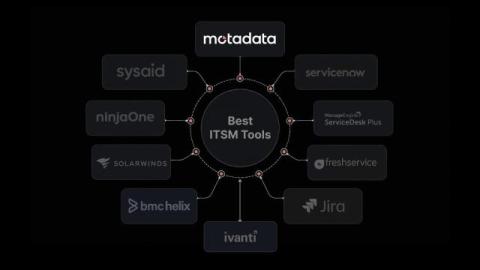
10 Best ITSM Tools in 2026 [Reviewed and Compared]

How do you choose the best ITSM tool for your team when 20 vendors all promise the same three things: native AI, ITIL alignment, and a single system to run your whole IT operation? It is the fair question we hear most from IT managers and service desk leads, and the cost of getting it wrong is high. An ITSM platform is a multi-year commitment where your team works inside every day, so a poor fit shows fast as slow tickets, manual workarounds, and a migration nobody wants to repeat.
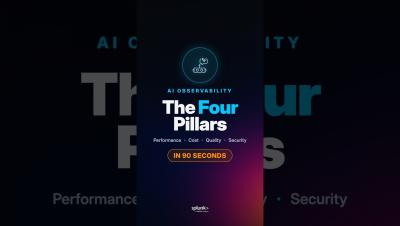
The Four Pillars of AI Observability in 90 Seconds

AI applications can behave unpredictably, potentially leading to errors such as hallucinations or data leaks, even when classic monitoring indicates a successful response. To effectively monitor AI systems, four key areas should be focused on. Implementing these pillars can enhance trust in AI deployments, help manage costs, and identify safety issues before they impact users.

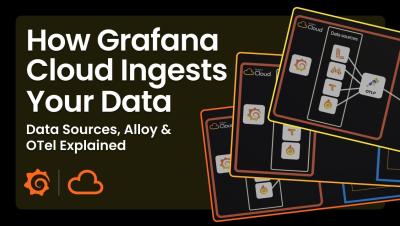
How Grafana Cloud Ingests Your Data | Data Sources, Alloy & OTel Explained

Learn the two main ways to get data into Grafana Cloud. In this video, we break down how Grafana Cloud connects to over 150 external data sources (like Salesforce, Postgres, and CloudWatch) where your data stays in place, and how you can send raw telemetry into Grafana’s fully managed databases for logs, metrics, traces, and profiles.

Real Time Network Monitoring: Topology, NetFlow, SNMP

Interface counters tell you a port is busy. Bytes in, bytes out, errors, drops. That’s enough to know a link is saturated, but not enough to know which conversations are saturating it, which devices are involved, or how a problem propagates across your network. For that you’ve traditionally needed dedicated network performance monitoring tools, usually expensive, usually a separate console from the rest of your monitoring.

How Git Worktrees Changed My Development Workflow

Since I started using Claude Code more frequently, I kept noticing a “worktree” checkbox popping up whenever I started a session in a Git repository. I had no idea what it meant, so I did what any curious developer would do and started digging. What I found was a Git feature I somehow never came across before: git worktrees.

Telegraf Enterprise Now Generally Available: Manage Telegraf Fleets at Scale

Telegraf Enterprise is now generally available. It combines Telegraf Controller, a centralized management console for Telegraf, with official support from InfluxData. Open source Telegraf remains unchanged. Telegraf Controller is free to start with built-in limits, while a Telegraf Enterprise license unlocks higher-scale limits, audit logging, LDAP/OIDC integration, and commercial support. Telegraf has become the standard for collecting telemetry across cloud, edge, and physical infrastructure.

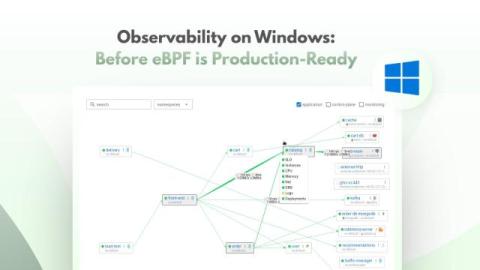
Observability on Windows, before eBPF is production-ready

No large enterprise runs a single stack. A shiny new Kubernetes cluster sits right next to a Windows Server box that has quietly run the billing system for a decade without missing a beat. Both keep the business running. Both deserve the same visibility. Linux runs most server workloads, and Coroot grew up there. Our open-source node-agent uses eBPF to collect metrics, logs, traces, and profiles, with no code changes. But "most" is not "all".