Operations | Monitoring | ITSM | DevOps | Cloud

The latest News and Information on Monitoring for Websites, Applications, APIs, Infrastructure, and other technologies.

Experience-Driven NetOps: The Integration of AppNeta and DX NetOps

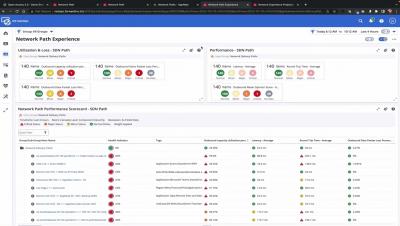
AppNeta and DX NetOps enable Experience-Driven NetOps by bringing user experience and visibility across both managed and unmanaged networks into a unified console. Start with alarms and drill down to see the details of performance along the complete network path, hop by hop, including information about voice and data to understand issues over time. Use dashboards to see insights into the health of your network delivery paths across your organization and drill-in to isolate the problem with detailed reports including network experience capacity projections for ISPs.

Observability: How to Boost Gaming Performance in 5 Ways

For a game to provide the best user experience, certain elements come into play. These factors can be hardware components in the user’s computer, like the CPU and GPU, operating system settings, or specific game settings. In fact, if there’s misalignment between these components and a game’s intensity, performance issues can crop up. The most common performance issues in gaming include frame rate drops, input lag, stuttering, rendering issues and network latency.

Best Cloud Monitoring Tools (Open Source & More)

Cloud monitoring tools are utilized to gather an extensive range of metrics and logs from cloud resources and services. Some commonly monitored metrics include CPU utilization, memory usage, network traffic, disk I/O, latency, and response time. By monitoring these metrics, among others, it becomes possible to gain insights into resource utilization, identify performance bottlenecks, and ensure that the infrastructure operates according to expectations.

How to fix performance issues using k6 and the Grafana LGTM Stack

The Grafana Labs ecosystem is built on a range of different projects that incorporate logs, metrics, traces across load testing, and Kubernetes monitoring. I’ll assume you know all of that data (and more!) can be visualized in Grafana. What made my observability dream become reality, though, is how these systems can work together to help you effectively debug performance issues and operate your system with more confidence.

How to run faster Loki metric queries with more accurate results

Today I want to talk about metric queries. More specifically, I want to talk about an important concept that is going to make your queries run faster, give you more accurate results, and make your Grafana Loki operators (like me) much happier. A metric query in Loki looks like this: And the part I want to talk about is that at the end. Now, if you’re like me and have a short attention span and are already bored — I understand.

Troubleshooting Bad Health Checks on Amazon ECS

Health checks are an important factor when working with containerized applications in the cloud and are the source of truth for many applications in terms of their running status. In the context of AWS Elastic Container Service (ECS), health checks are a periodic probe to assess the functioning of containers. In this blog, we will explore how Lumigo, a troubleshooting platform built for microservices, can help provide insights into container crashes and failed health checks.

Save 96% on Data Storage Costs

Users with real-time and other analytic workloads want or need to keep large volumes of historical data to aid in important activities, such as ad hoc historical trend analysis and training AI models. However, storing this much data in a way that also makes it easily queryable becomes prohibitively expensive. As a result, users must balance data availability and usability with sacrificing data fidelity and storage costs. That is until now.

Graphios - Connecting Graphite and Nagios

Graphios simplifies the process of sending Nagios performance data to backend systems like Graphite. With Graphios, users can easily integrate Nagios with Graphite, eliminating the need for complex scripts. This article explores Graphios' functionality, configuration, and installation process, empowering users to efficiently transfer Nagios data for monitoring and analysis.