Operations | Monitoring | ITSM | DevOps | Cloud

The latest News and Information on Monitoring for Websites, Applications, APIs, Infrastructure, and other technologies.

8 Kubernetes application performance monitoring challenges and how to solve them

Kubernetes is a widely-adopted platform that manages the containers that host an application. Instead of handling nodes and containers individually, it groups all workloads as orchestrated layers. This abstraction simplifies the overall complexities involved, making the application easier to manage.


SEO monitoring trends to watch in 2024

2023 was a landmark year in SEO, and not for entirely positive reasons. After the emergence of OpenAI and ChatGPT and the realization that AI-powered search was the future focus of major search players like Google and Microsoft, SEO monitoring professionals were rightly thrown into an uncertain landscape. Would traditional search, and all of its standard practices and strategies, disappear within months? What about the ideas of “content is king” and the importance of link-building?

Compare Tests In RapidSpike

Last year we released the “Failure Analysis” dashboard to allow you to compare a failing result with the latest successful one. The feedback was universally positive: users loved being able to compare tests! So we have now released a full comparison tool to allow you to compare any two User Journey or Page Load test results on your website(s). Website test comparison can be useful for analysing and testing website changes.

Grafana vs Splunk - Key Features and Differences

Grafana and Splunk are both used as monitoring tools. But while Grafana is majorly used as a data visualization tool, Splunk is an enterprise security and observability platform. Monitoring tools are essential for any business that wants to have visibility into its IT infrastructure. They provide real-time data that can be used to identify and troubleshoot problems. Grafana and Splunk are two of the most popular monitoring tools on the market. So, which one is better for your business?

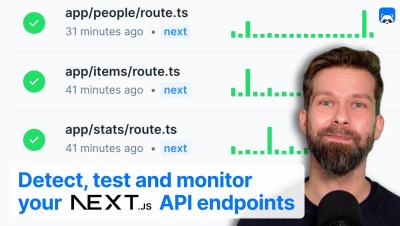
How to detect, test and monitor your Next.js API endpoints with the Checkly CLI

In this video, we explore how to use the Checkly CLI to programmatically test and monitor Next.js API endpoints. We'll create a dynamic setup that detects new API GET URLs and use GitHub actions to test preview API deployments and deploy API monitoring after production deploys.

SigNoz Launch Week - Day 5 - Access Token Mgmt & Onboarding

Welcome to last day of SigNoz Launch Week! We will start with a chat with Ankit (CTO, SigNoz) about the evolution of SigNoz, our focus on OpenTelemetry and belief in open-source. Post that we will deep dive into recently released Access Token management feature which will help users programmatically access data stored in SigNoz and unlock powerful use cases. Then we will showcase our new SaaS onboarding flow which makes getting started with SigNoz much easier. We will also discuss the process we follow for improving our documentation & onboarding flow.

10 Best Open-Source Monitoring Tools for DevOps in 2024

We're StatusPal. We help DevOps and SRE streamline incident and maintenance communication with a powerful status page that integrates nicely with your monitoring and observability tools. Check us out!. In 2024, monitoring is essential to modern DevOps teams' work. DevOps teams need reliable and flexible tools to effectively monitor and manage complex systems that can provide real-time insights into system performance, availability, and security.
Sponsored Post

Analyzing SASE DEM Solutions

Vendors across security sectors are now offering their own digital experience monitoring products, especially when the security products can impact customer networks and performance at various levels. While these monitoring tools can provide valuable information to customers, it raises concerns about whether there is a potential conflict of interest between the vendor and the customer. If the SASE platform or security tools are introducing latency and slowing response times, how can the monitoring tools be trusted to accurately reflect their overhead?

OpUtils MAC address tracker: We have got your network's back!

The missing piece in your effective resource management strategy is MAC address tracking. Using IPs to track network resources can be unreliable since they are not permanently associated with a specific device. MAC addresses, on the other hand, are unique and permanently associated devices offering inherent stability. Here’s a quick refresher on MAC addresses.

SigNoz Launch Week - Day 4 - Logs Pipeline

For day 4, we will showcase the recent work we have done in Logs Pipeline. With Log Pipelines, you can transform logs to suit your querying and aggregation needs before they get stored in the database. Pipelines provide a way to modify the structure and content of log data without needing to change application code or redeploy components. By extracting relevant attributes from logs, pipelines enable more efficient analysis.