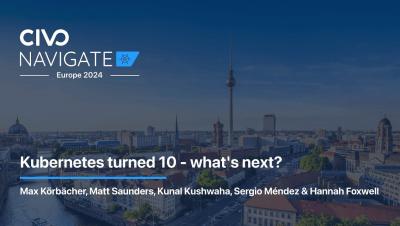
Operations | Monitoring | ITSM | DevOps | Cloud

Getting started with GitHub Data source plugin - Visualize your repos | Grafana

Learn step-by-step how to monitor and visualize your GitHub data by using the Grafana GitHub Data source plugin. It provides a lot of features such as query Commits, Pull Requests, Workflows, Vulnerabilities etc. Join Senior Developer Advocate Syed Usman Ahmad in this complete video tutorial and learn to use the GitHub plugin.

How to Query Span Events with TraceQL | Tempo Tutorial | Grafana Labs

Span events provide many benefits and can help you improve your distributed tracing game. In this video, the Grafana Tempo team goes over when to add span events to your traces. We will show you how to use TraceQL to query for span events to get useful information about your services to help you track down bugs and chase down bottlenecks faster. Grafana Cloud is the easiest way to get started with Grafana dashboards, metrics, logs, and traces.

What is Application Performance Monitoring (APM) & How It Works | Obkio NPM Onboarding Series

Welcome to Obkio’s App! In this video, we’ll be exploring the “Application Performance” tab within the app. You can use Application Performance Monitoring (APM) to monitor web and application performance, and more specifically, to test any website or web application from an HTTP or HTTPS point of view. APM helps you understand if network issues are coming from your local network or not.

What Are Monitoring Agents & How to Deploy & Configure Them | Obkio NPM Onboarding Series

Welcome! In this video, we’re discussing Network Monitoring Agents in Obkio’s Network Performance Monitoring App. Monitoring agents (software, hardware, virtual appliance) are be deployed to monitor network performance in all network locations. This video will also teach you how to create new Monitoring Agents or to modify or delete Agents you already have in your account.

Getting Started with Grafana Plugin Development | Grafana Plugin Development

Learn how to get started creating Grafana plugins with this comprehensive guide that covers the tools you will need, the different types of plugins to choose from, the anatomy of a Grafana plugin, how to run your Grafana plugin in development mode, as well as outlines the next steps.

Welcome to the Experience Driven NOC Network Path Change Alarms and Drill Down Context Pages

On your journey to the Experience-Driven NOC, DX NetOps 22,2 is enabling network operations centers to utilize their standard operating procedures and workflows to triage the performance of the entire network path of any user experience - over managed or unmanaged networks. As with any workflow, we start with an alarm and enable operations to drill down, in-context to the offending network device; giving operators enhanced visibility into network path performance along with key KPIs for focused troubleshooting on any and all user experience impact.

Myth #5 of Apache Spark Optimization | Spark Dynamic Allocation

Spark Dynamic Allocation is a useful feature that was developed through the Spark community’s focus on continuous innovation and improvement. While Apache Spark users may believe Spark Dynamic Allocation is helping them eliminate resource waste, it doesn’t eliminate waste within applications themselves. Watch this video to understand SDA's benefits, where it falls short, and the solution gaps that remain with this component of Apache Spark.