When I joined Honeycomb two years ago, we were entering a phase of growth where we could no longer expect to have the time to prevent or fix all issues before things got bad. All the early parts of the system needed to scale, but we would not have the bandwidth to tackle some of them graciously. We’d have to choose some fires to fight, and some to let burn.
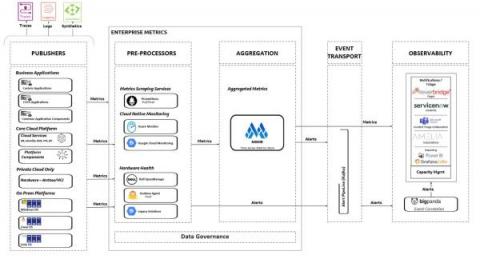
Think of a monitoring tool — any monitoring tool. Got it? Good. Odds are, whatever came to mind was probably being used behind the scenes at Wells Fargo not too long ago. “You name it, and we probably had it at Wells Fargo,” said Senior Software Engineering Manager Nikhilesh Tekwani of the complex web of observability solutions that stretched across the U.S.-based financial institution.
As the world emerges from the pandemic, governments are shifting focus to modernize their IT landscapes seeking security, efficiency, and a better experience.
Seagate Lyve™ Cloud is a storage-as-a-service platform that delivers S3-compatible object storage with a simple and predictable cost structure. It offers ultra-high durability and scale along with enterprise grade security and uptime. When it comes to the reliability and resiliency of the Lyve Cloud Service, there are simply no compromises.
The economy’s mixed messages—slow growth and high inflation, combined with resilient employment and consumer demand—are spurring business leaders to focus on ways to boost productivity, drive growth, retain customers, and remain competitive. A 2023 survey of 1,000 C-suite executives by ServiceNow and ThoughtLab found digital activities continue to be a key element of their strategic plans. This is especially true for companies that have prioritized digital innovation in the past.
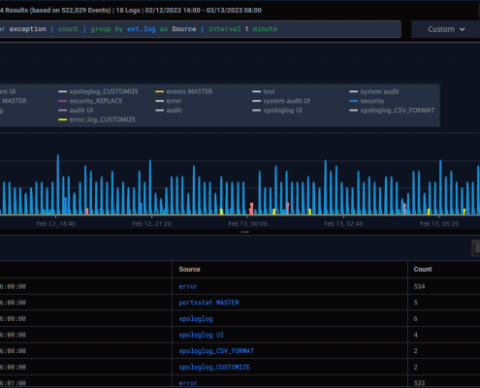
Simplified analysis. Enhanced visualizations, alerting capabilities, advanced data forwarding, and more. Great news! We have published a new update with many exciting new features and optimizations.
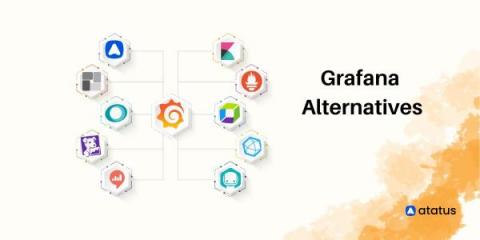
Grafana is a powerful open-source data visualization platform created by Torkel Ödegaard in 2014. With its front-end written in Typescript and a Golang back-end, this data monitoring platform allows users to create and share interactive and dynamic dashboards with custom charts and panels using data from various sources, including InfluxDB, Prometheus, Elasticsearch, and many others. Template variables are also available as dropdown options to create dynamic and reusable dashboards.