Operations | Monitoring | ITSM | DevOps | Cloud

The latest News and Information on Monitoring for Websites, Applications, APIs, Infrastructure, and other technologies.

Bindplane Expands Partnership with Google Cloud

We're only one month into 2025, but the momentum keeps building at Bindplane. In January, we rebranded our company as Bindplane, aligning our company name with our core mission: delivering the best OpenTelemetry-native telemetry pipeline on the market. Building on that excitement, we have another announcement: we've expanded and extended our partnership with Google Cloud.


What Are Network Packets & How to Monitor Them: The Secret Life Of Network Packets

Ever wonder how the Internet actually works? It’s not just magic (though it sometimes feels that way). Behind every webpage you load, every video call you make, and every meme you send, tiny digital messengers called network packets are zipping through cyberspace, carrying data from one point to another. Think of them as the text messages of the Internet; small, efficient, and sometimes frustrating when they don’t arrive on time. But what exactly are network packets? How do they work?

Breakpoint recap: Uptime Monitoring, robots, and feature flags galore

Bugs don’t announce themselves politely. They crash your checkout flow, break authentication, or slow your API to a crawl—usually right before your CEO asks how things are going. And when the error inbox is flooded with a hundred variations of TypeError: cannot read property of undefined, figuring out what actually matters can feel impossible.

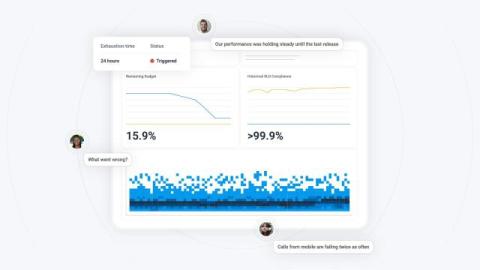
Slicing Up-and Iterating on-SLOs

One of the main pieces of advice about Service Level Objectives (SLOs) is that they should focus on the user experience. Invariably, this leads to people further down the stack asking, “But how do I make my work fit the users?”—to which the answer is to redefine what we mean by “user.” In the end, a user is anyone who uses whatever it is you’re measuring.

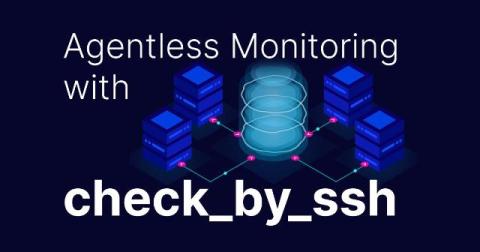
How to do Agentless Monitoring with check_by_ssh

The fundamentals of Icinga 2 are check plugins. They are being executed and their return value is mapped to either Host or Service objects. Everything else follows on top. These check plugins can be either from the Monitoring Plugins or custom. While their origin does not matter, they are the building blocks of an Icinga monitoring stack. If a plugin goes CRITICAL, Icinga 2 alerts the sysadmin.

Manage All Your App Notifications in One Place with AppSignal

Alerts and notifications are the backbone of any Application Performance Monitoring (APM) tool, ensuring your team is immediately aware of critical issues. At AppSignal, we’re always improving our toolkit to help you stay ahead of problems before they impact performance or reliability. We've made huge improvements to how you can manage your app notifications and alerts with AppSignal.

Diagnosing ActiveMQ broker performance issues with log analysis

Apache ActiveMQ is a widely used message broker that enables seamless communication between distributed applications. However, as the volume of messages increases, performance bottlenecks can arise, leading to slow message processing, high latency, broker crashes, and out of memory (OOM) errors. One of the most critical issues affecting ActiveMQ is OOM errors, which occur when the broker exceeds its allocated heap memory. This can result in service failures, message loss, and prolonged downtime.

How to leverage AI to enhance network monitoring in retail: A CXO's guide

The retail industry has evolved into a mix of physical stores, e-commerce, digital payments, and omnichannel interactions. Now, GenAI has been added to this mix, which changes how people shop, how retailers operate, and how employees work. While this shift creates opportunities for retailers of all sizes, it also presents serious challenges in maintaining network performance and staying compliant with industry regulations.

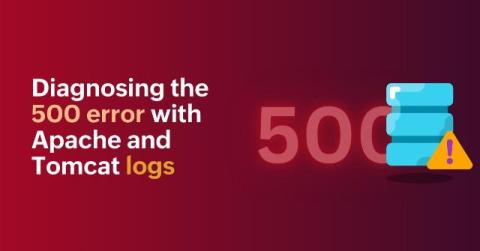
Diagnosing and resolving the 500 internal server error with Apache and Tomcat logs

The dreaded 500 internal server error is a common challenge for web administrators, often signaling a disruption in server operations. Diagnosing the root cause requires in-depth visibility into both web server and application behavior. In this blog, we’ll explore how log management tools simplify the diagnosis and resolution of 500 errors by leveraging insights from both Apache and Tomcat logs.