Operations | Monitoring | ITSM | DevOps | Cloud

The latest News and Information on Monitoring for Websites, Applications, APIs, Infrastructure, and other technologies.

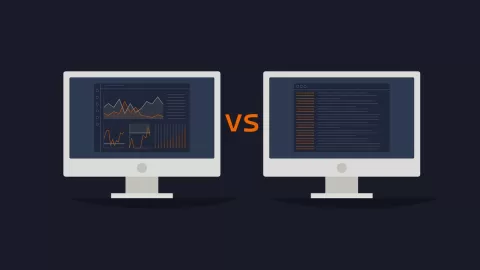
Logging vs. Metrics

When discussing observability, the “big 3” - logs, metrics, and traces, always get mentioned. But for some, more data doesn’t always mean better. Our lead engineer, JJ, had some advice to share about how logs may not be necessary for everyone. Simplifying your observability stack isn’t difficult - you just need to be intentional with implementation. Check out more MetricFire blog posts below, and our hosted Graphite service! Get a free trial and start using MetricFire now!


Manage your network with ManageEngine Site24x7!

As a network administrator, you know how critical it is to ensure seamless network performance, optimize bandwidth, and secure your infrastructure. But with the growing complexity of modern networks, staying on top of everything can be overwhelming. That’s where ManageEngine Site24x7 comes in! In this video, we dive into how Site24x7, a comprehensive network observability solution, empowers you to.

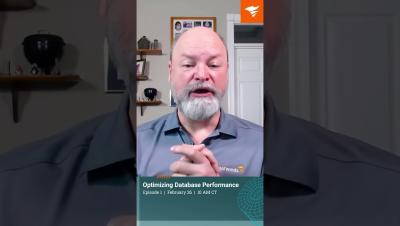
Optimizing Database Performance, Episode 1: The Solid Foundations of Database Design

Join our resident database expert, Kevin Kline, for our upcoming webcast, “Optimizing Database Performance, Episode 1: The Solid Foundations of Database Design.” We’re going back to basics and focusing on how poor database design can impact even the most powerful and expensive hardware.

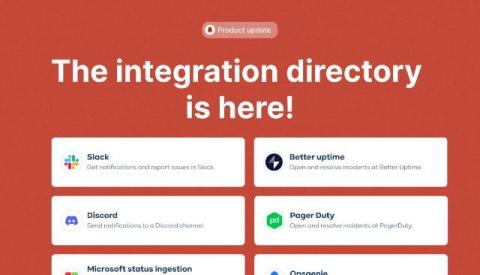
The integration directory is here!

Keeping your team informed about service disruptions has never been easier. The StatusGator Integration directory, available in the Menu on our website, allows you to explore all the integrations we support in one place. From collaboration tools to incident management platforms, we help you integrate status updates seamlessly into your workflow.

Grafana Cloud updates: Exemptions in Adaptive Logs, GPU monitoring in AI Observability, and more

We consistently roll out helpful updates and fun features in Grafana Cloud, our fully managed observability platform powered by the open source Grafana LGTM Stack (Loki for logs, Grafana for visualization, Tempo for traces, and Mimir for metrics). In case you missed them, here’s our monthly round-up (the first of 2025!) of the latest and greatest Grafana Cloud updates. You can also read about all the features we add to Grafana Cloud in our What’s New in Grafana Cloud documentation.

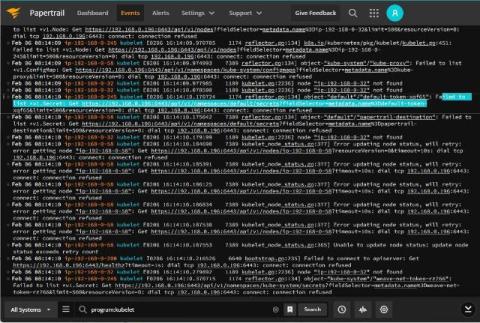
Investigating Kubernetes Issues with Papertrail

While Kubernetes aims to streamline containerized application management, its multi-layered architecture creates potential points of failure. Problems in any of these layers can manifest as application crashes, resource overutilization, or failed deployments, making cluster maintenance a persistent challenge. Kubernetes meticulously logs all aspects of cluster activity and application output, from individual Pods to ReplicaSets.