NiCE Management Packs | What Makes Them So Unique
NiCE Management Packs for Microsoft SCOM. Vendor session at SCOMathon 2021


The latest News and Information on Monitoring for Websites, Applications, APIs, Infrastructure, and other technologies.
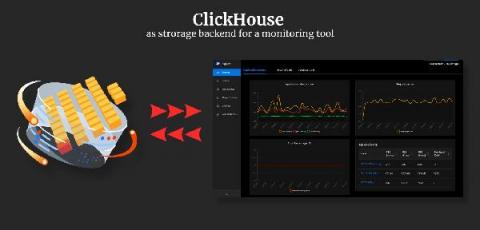
In this article, we dig deeper into why we decided to extend support for ClickHouse as a storage backend for SigNoz and the efficiency gains we achieved using it.
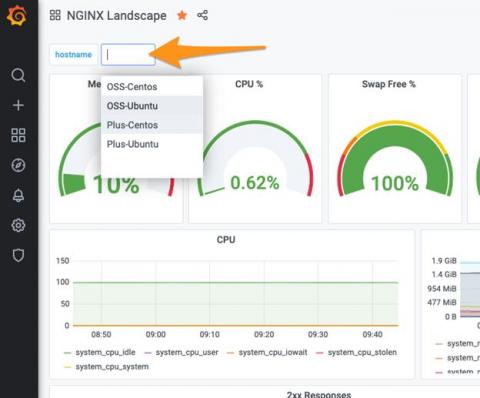
Grafana is an extremely powerful application and infrastructure observability and health platform. The ability to quickly generate operational insights from an amalgamation of sources is compelling. Grafana also benefits from the ability to natively query a Prometheus endpoint to display time-based metrics for display in a dashboard. We’ve built the NGINX Instance Manager tool to measure the health of your NGINX instances with the help of Grafana.
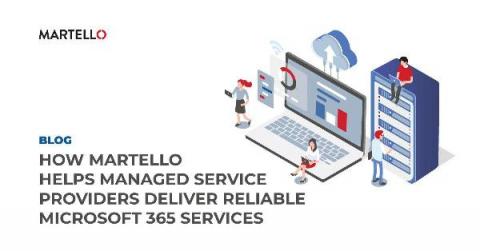
It’s no secret that the modern era in which we live and work must fulfill an ever-increasing demand for digital transformation, especially when it comes to business. Microsoft Teams’ growth over the past year has been exponential, and while many companies rely on Microsoft 365 for their business continuity, very few of them have the tools to manage and support these services internally.
Previously, I wrote a Beginner’s Guide to Jaeger + OpenTracing Instrumentation for Go providing guidance on manually instrumenting Go services. This is useful for cases where we want fine-grained tracing of specific functions. However, what if all we want is to trace a service’s inbound and outbound calls with little to no additional code?
We are constantly working to make Icinga even better by adding new useful features. We will be releasing Icinga Web 2 version 2.9.0 very soon. This version will have many new interesting features. One of these functions gives you the option to change the theme mode to Dark, Light or Auto. The default Icinga theme will come with all three modes and will use Dark as the default theme mode. You can change it at any time in the account preferences.
NagiosXI is the proprietary heir of one of the best-known tools in IT to monitor systems without a license, that is, as a free product. As a free product, Nagios (without XI) is a product that is almost 20 years old and suffers from many shortcomings, but for many years it has been the standard among “free” products and it fulfilled its role in those cases where the budget was quite short or the features needed were just a few.