Operations | Monitoring | ITSM | DevOps | Cloud

The latest News and Information on Monitoring for Websites, Applications, APIs, Infrastructure, and other technologies.

Logz.io's New Lookz is Generally Available!

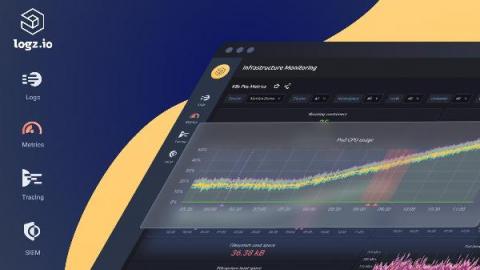
Back in June, we announced the Public Beta for Logz.io’s New Lookz – which is a new UI that completely changes the way users navigate across Logz.io products and features. The Public Beta gave users the option to toggle between the old and new UIs to see which one they liked better. And the answer from our users was as clear as it could be.

You can now customize the names of services in StatusGator

StatusGator is the easiest way to publish a unified status page featuring the status of all the services you depend on. Our public status dashboards have become a favorite feature allowing schools, startups, and enterprises alike to publish a quick and easy page showing the status of all their cloud services. One commonly requested feature has been the ability to customize the name of each status page listed in your dashboard.

How to extend the Geth collector

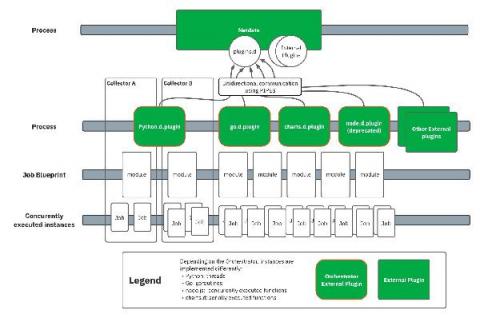
This is the the last of a 2-part blog post series regarding Netdata and Geth. If you missed the first, be sure to check it out here. Geth is short for Go-Ethereum and is the official implementation of the Ethereum Client in Go. Currently it’s one of the most widely used implementations and a core piece of infrastructure for the Ethereum ecosystem. With this proof of concept I wanted to showcase how easy it really is to gather data from any Prometheus endpoint and visualize them in Netdata.

How Do You Know Your Website is Down?

Did you know that California was one of the earliest adopters in the world for earthquake automated detection? Though rudimentary, early systems were literally horns strapped to government buildings, the idea was simple: sound an alarm the moment that an earthquake could be confirmed. The critical period of warning residents get can prove the difference between finding shelter and securing your family. In a land where earthquakes level buildings, detection was critical.

Introducing our new support bubble

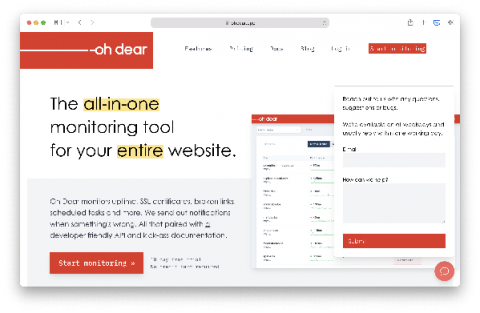
Like most SaaS products, Oh Dear is a living platform. We add new features proposed by our users, fix bugs that get reported, and regrettable also sometimes introduce new bugs. Most users use email to communicate with us. Even though sending an email is often perceived as friction-free, it can be a minor hurdle. We've introduced a little support bubble at the bottom of every page to make it easier for our users to pass us feature requests and report bugs.

3 Ways to Use the xMatters and Google Operations Suite Integration

Not too long ago, you would have needed development experience to oversee the delivery of scalable and reliable software. But with the rise of low-code and no-code tools, that requirement is now obsolete. What used to be hours of coding has turned into a few minutes of dragging and dropping.

Workload Pricing and SVCs: What You Can See and Control

The Cloud Monitoring Console (CMC) lets Splunk Cloud Platform administrators view information about the status of a Splunk Cloud Platform deployment. For workload pricing, the CMC lets you monitor usage and stay within your subscription entitlement. From the CMC you can see both ingest and SVC usage information and can gain insight into how your Splunk Cloud Platform deployment is performing.

What is Splunk Virtual Compute (SVC)?

A Splunk Virtual Compute (SVC) unit is a powerful component of our workload pricing model. Historically, we priced purely on the amount of data sent into Splunk, leading some customers to limit data ingestion to avoid expense related to high volumes of data with low requirements on reporting. With Splunk workload pricing, you now have ultimate flexibility and control over your data and cost.