Observability vs. Monitoring
Observability vs monitoring, what is the difference? Monitoring is the what to observability’s why. Here we dig into the differences.


The latest News and Information on Monitoring for Websites, Applications, APIs, Infrastructure, and other technologies.
Observability vs monitoring, what is the difference? Monitoring is the what to observability’s why. Here we dig into the differences.
The cloud and Electric Vehicles (EVs) have a lot in common. Both are modern, fast, and agile. Both are also in great demand. Every street seems to have an EV parked somewhere. It’s the same with the cloud, which is fast becoming the platform of choice to power enterprise applications. Whether it is public, private, or hybrid, the cloud offers flexibility, security, and low total cost of ownership.
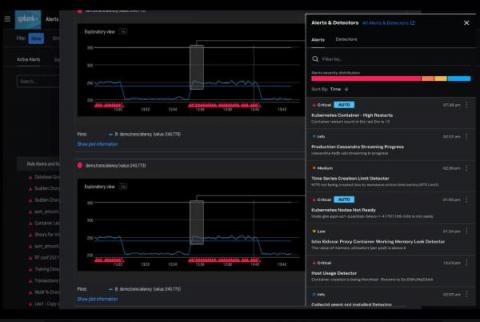
This year at.conf21, we announced exciting new features in Splunk Infrastructure Monitoring, our real-time streaming metrics-based monitoring platform. Our innovations help SRE and cloud operations teams detect and resolve performance issues even more quickly and efficiently while maintaining enterprise-grade security and compliance posture. In this roundup blog, we cover, in detail, all the product features we unveiled at.conf21.
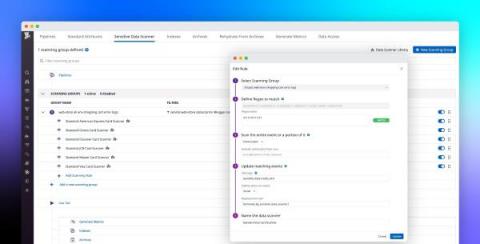
Within distributed applications, data moves across many loosely connected endpoints, microservices, and teams, making it difficult to know when services are storing—or inadvertently leaking—sensitive data. This is especially true for governance, risk management, and compliance (GRC) or other security teams working for enterprises in highly regulated industries, such as healthcare, banking, insurance, and financial services.
It’s nearly here. The annual mad rush at the wee hours of the morning. The stampede into retail stores to claim really deep discounts on the latest toys, electronics, and gadgets makes headline news every year. It begins the day after Thanksgiving and is usually two of the biggest shopping days of the year. Yes, we’re talking about Black Friday and Cyber Monday.
In the last 2 installments (Part 1 & Part 2), we discussed the basics of IoT and an example of how the components can be connected and used to provide basic automation and alerting. These seemingly simple steps can build up to provide very advanced controls of all aspects of the physical world. The challenge can become managing situations that were not expected.
When monitoring a large IT infrastructure, there are multiple aspects you need to keep under control. Doing things manually and relying on people to ensure the infrastructure reliability can be a wrong decision and mislead you when resolving issues or troubleshooting problems. All these complexities faced while managing a large ecosystem can seem hard to overcome, but in reality, they can be handled.
NGINX is a popular web server featuring a wide range of capabilities, including reverse proxy, mail proxy, HTTP cache, and load balancing. It offers TLS offloading and a health check of the backends and supports gRPC, WebSocket, and HTTP/2. In short, NGINX is a one-stop solution for most of your web server needs. When using NGINX, monitoring its metrics is crucial for tackling issues.