Top Five Takeaways from Cisco Live EMEA
Our Sr. Product Manager, Taylor Johnson, attended Cisco Live EMEA in Amsterdam last week, and here are his top five takeaways from this amazing event.


The latest News and Information on Monitoring for Websites, Applications, APIs, Infrastructure, and other technologies.
Our Sr. Product Manager, Taylor Johnson, attended Cisco Live EMEA in Amsterdam last week, and here are his top five takeaways from this amazing event.
In today’s economic climate, IT and security budget owners are always looking for ways to increase efficiency while controlling costs. With tighter budgets and increasing workloads, organizations have to find ways of stretching their limited resources while making sure investments are paying off.
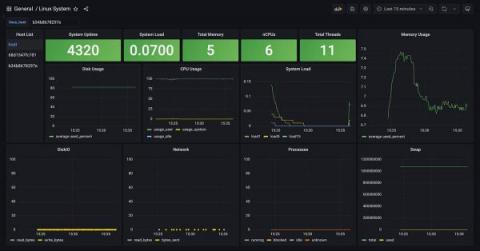
Grafana has been a staple visualization tool used alongside InfluxDB since its inception. With the release of InfluxDB Cloud powered by IOx, there is now a new way to integrate InfluxDB and Grafana: Flight SQL. Two of our engineers, Brett and Helen, have been working hard to create a new Grafana plugin called Flight SQL. This open-source plugin allows users to perform SQL queries directly against InfluxDB IOx and other storage engines compatible with Apache DataFusion.
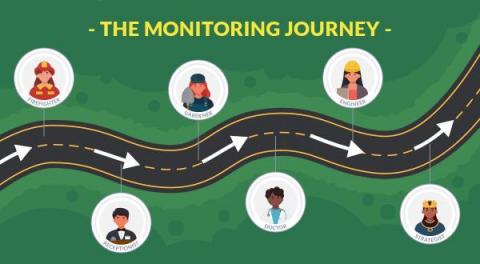
Monitoring is not a goal, but a path. Depending on the maturity of your project, it can be labeled in one of these six steps of the cloud monitoring journey. You will find best practices for all of them and examine what companies get from each one. From classic virtual machines to large Kubernetes clusters or even serverless architectures, companies have adopted the cloud as a mainstream way to provide their online services.
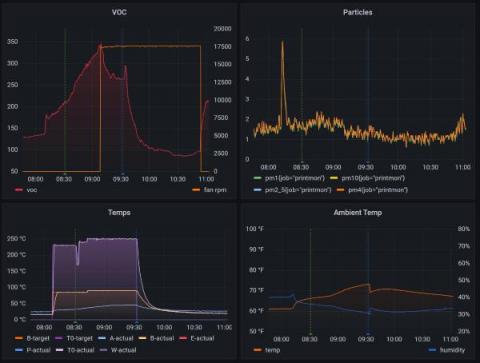
I lead the Grafana Loki project here at Grafana Labs, and I’ve always loved building things professionally and in my personal life, whether we’re talking about metalworking or coding — or, more recently, 3D printing. A couple years ago, I purchased my first 3D printer, a Prusa i3 MK3S+. I use it periodically to build functional items I use around my house in Upstate New York. For example, I recently decided to build a solar radiation shield for my outdoor weather station.
An Azure Load Balancer is a Layer-4 (TCP, UDP) load balancer that provides high availability by distributing incoming traffic among healthy VMs. A load balancer health probe monitors a given port on each VM and only distributes traffic to an operational VM. Azure Load Balancers are frequently used in Azure Virtual Desktop (AVD) deployments. From our work with Azure Load Balancer, we think there are 4 key metrics and events you should proactively monitor and alert on.
Artificial Intelligence (AI) - or more specifically Machine Learning (ML) - and automation were big topics for many of our customers in 2022. Common reasons for the interest in AI and automation were to: increase efficiency, reduce manual processing, minimise human error and - especially for the use of ML - identify ‘unknown unknowns’.