Operations | Monitoring | ITSM | DevOps | Cloud

The latest News and Information on Monitoring for Websites, Applications, APIs, Infrastructure, and other technologies.

Stop Viewing Cybersecurity as an Expense

Nine. Million. Dollars. Well, $9.44 million to be exact for your average data breach according to the latest report from IBM, Cost of a Data Breach Report 2022. From 2017 to 2022, that number has only continued increasing from $7.35 million, an almost 30% increase in just five years. For a small company, a security breach can be the difference between staying open or closing the business. And for a Fortune 500 enterprise, that cost will be more severe.

Grafana k6 v0.44.0 release: web crypto API, Web Vitals metrics, and more!

Grafana k6 v0.44.0 has been released, featuring new experimental modules, an upgraded browser module, and tons of improvements. Get Grafana k6 0.44.0 Here’s a quick overview of the latest k6 news from the team and the community.

SCOM Authoring: How to use the module System.ExpressionFilter

System Center Operations Manager, SCOM, is a powerful tool for monitoring IT infrastructure, but sometimes the default monitoring criteria are not optimal to fit your specific needs. That is where the System.ExpressionFilter module comes in - it allows developers to create customized monitoring criteria tailored to fit the requirements of their particular organization.

Live from KubeCon: Insider Insights with CNCF's Head of Ecosystem

We’ve just recently completed KubeCon + CloudNativeCon Europe 2023 in Amsterdam, one of the signature events of the year in the cloud native, open source and observability spaces. I was thrilled to be joined by Taylor Dolezal, the Head of Ecosystem for the hosting Cloud Native Computing Foundation (CNCF) to discuss the insider happenings of KubeCon EU live from Amsterdam for the April 2023 OpenObservability Talks podcast.

Observability: A Complete Guide

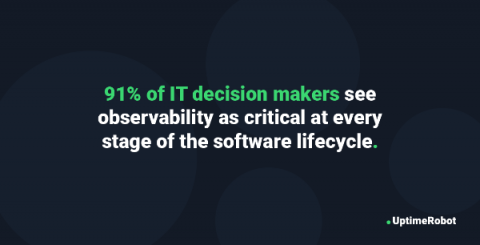
As technology advances, so does the need for software engineers and DevOps teams to understand the precise inner workings of the systems they create. In 2023, observability is quickly becoming a key factor in gaining success for many businesses. The study states that many businesses are in different stages of adopting observability into their arsenal of tools, and that the need for these practices is on the rise.

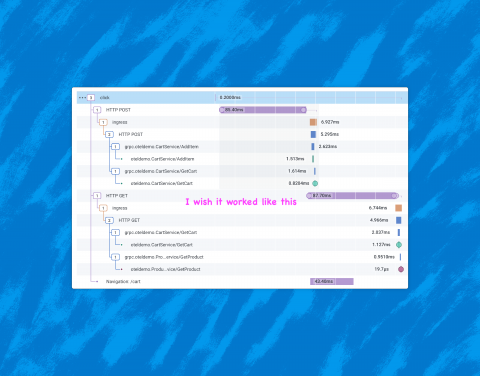
Observable Frontends: the State of OpenTelemetry in the Browser

The modern standard for observability in backend systems is: distributed traces with OpenTelemetry, plus dynamic aggregations over these events. This works very well in the world of web servers. But what about the web client? This post describes the state of OpenTelemetry support for React web clients, as of early April 2023.

What's New in Sysdig - March & April 2023

This month, Sysdig Secure’s Container Registry scanning functionality became generally available for all users. This functionality provides an added layer of security between the pipeline and runtime scanning stages. On Sysdig Monitor, we introduced a feature to automatically translate Metrics alerts in form-based query to PromQL. This allows you to choose between the convenience of form and the flexibility of PromQL.

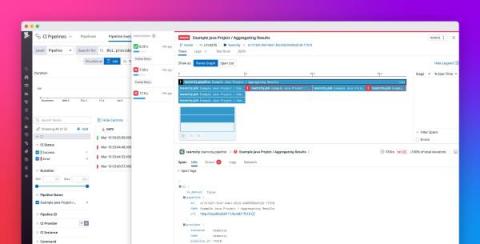
Monitor your TeamCity builds with Datadog CI Visibility

As the complexity of modern software development lifecycles increase, it’s important to have a comprehensive monitoring solution for your continuous integration (CI) pipelines so that you can quickly pinpoint and triage issues, especially when you have a large number of pipelines running.

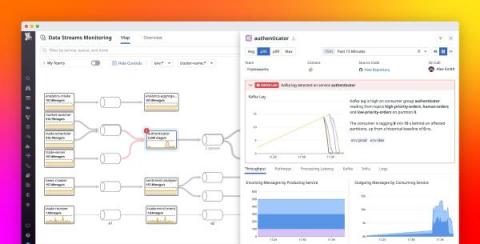
Track and improve the performance of streaming data pipelines with Datadog Data Streams Monitoring

When managing queues and services in streaming data pipelines that use technologies like Kafka and RabbitMQ, SREs and application developers often struggle to determine if these pipelines are performing as expected. Visibility into the performance of a streaming data pipeline, after all, requires visibility into every component of that pipeline.