The latest News and Information on Containers, Kubernetes, Docker and related technologies.
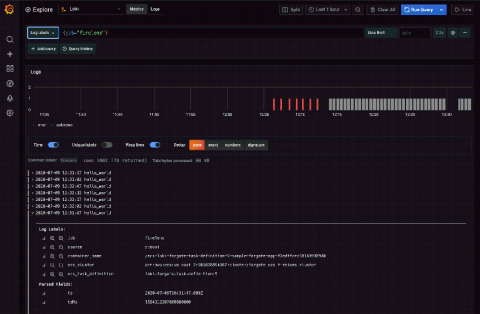
Kristian Zhelyazkov is a developer at SAP working on Gardener, the SAP-driven Kubernetes-as-a-service open source project. In this guest blog post, he explains why the project is moving its logging stack to Loki.
This article provides an overview of managing and analyzing Docker logs and explores some of the complexities that may arise when looking through the log data. We will go through the default logging approach, as well as look at some more advanced configurations that will make diagnosing issues in your Docker-hosted applications much easier going forward.
Calico was designed from the ground up with a pluggable dataplane architecture. The Calico 3.13 release introduced an exciting new eBPF (extended Berkeley Packet Filter) dataplane targeted at those ready to adopt newer kernel versions and wanting to push the Linux kernel’s latest networking capabilities to the limit.
This post is the third in our Kubernetes observability tutorial series, where we explore how you can monitor all aspects of your applications running in Kubernetes, including: We’ll discuss using Elastic Observability to perform application performance monitoring (APM) with the Elastic APM.
Log messages help us to understand data flow through applications, as well as spot when and where errors are occurring. There are a lot of resources for how to store and view logs for applications running on traditional services, but Kubernetes breaks the existing model by running many applications per server and abstracting away most of the maintenance for your applications. In this blog post, we focus on log management for applications running in Kubernetes by reviewing the following topics.
In this post, we will show how it’s easily possible to monitor AWS Lambda with Sysdig Monitor. By leveraging existing Prometheus ingestion with Sysdig, you will be able to monitor serverless services with a single-pane-of-glass approach, giving you the confidence to run these services in production.
Prometheus is a CNCF graduated project for monitoring and alerting. It is one of the most widely used monitoring and alerting tools in the Kubernetes ecosystem. Rancher users can leverage Prometheus quickly by using the built-in monitoring stack. Prometheus stores its metrics as a time series database on the local disk. Prometheus local storage is limited by the size of the disk and amount of metrics it can retain.
Hello and welcome to another issue of This Month in Qovery! Qovery helps developer to deploy their applications in the Cloud in just a few seconds. This is a monthly summary of its progress and community. Do you build something with Qovery? Do you want to be mentioned? Tweet us at @Qovery_ or reply to this email.