Dashboards
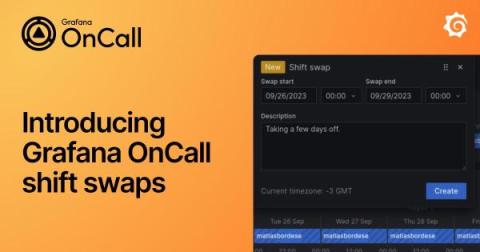
Introducing Grafana OnCall shift swaps: A simpler way to exchange on-call shifts with teammates
A family member’s birthday, that concert you’ve waited all year to see, an impromptu weekend getaway with friends — there are a lot of reasons software engineers might want to switch on-call shifts. And rather than have to frantically send Slack messages to your teammates, wouldn’t it be nice to automate the process and quickly find the coverage you need?
Customer Workshop 2023
This month, we were thrilled to welcome SquaredUp customers from all over the world to our in-person workshop in sunny Marlow, UK. It was a wonderful day of learning and sharing ideas, and a unique opportunity for SquaredUp users to meet the people behind the product (us!), network with like-minded customers, and get an exclusive look at the latest product updates. We were excited to showcase our Dashboard Server product roadmap and share our vision for the future of SquaredUp.
Data Visualization for Everyone: How To Simplify the Process
Introducing the Prometheus Java client 1.0.0
PromCon, the annual Prometheus community conference, is around the corner, and this year I’ll have exciting news to share from the Prometheus Java community: The highly anticipated 1.0.0 version of the Prometheus Java client library is here! At Grafana Labs, we’re big proponents of Prometheus. And as a maintainer of the Prometheus Java client library, I highly appreciate the support, as it helps us to drive innovation in the Prometheus community.
Observability at Scale Needs Summary
The shift from traditional monitoring to observability is widespread, and necessary. It's the way we make sense of increasingly complex and distributed systems. But when we capture all this data at scale... what do we do with it all? If this data itself had inherent value, we’d all be rich. But in the real world data does not provide us value until we can act on what it tells us.
OpenTelemetry metrics: A guide to Delta vs. Cumulative temporality trade-offs
In OpenTelemetry metrics, there are two temporalities, Delta and Cumulative and the OpenTelemetry community has a good guide on the different trade-offs of each. However, the guide tackles the problem from the SDK end. It does not cover the complexity that arises from the collection pipeline. This post takes that into account and covers the architecture and considerations that are involved end-to-end for picking the temporality.
Monitor multiple Azure subscriptions in a single dashboard
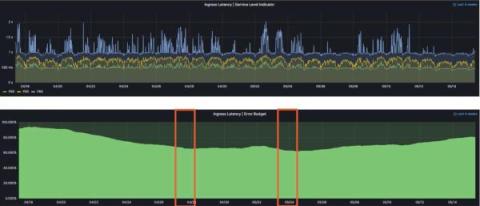
How to monitor SLOs with Grafana, Grafana Loki, Prometheus, and Pyrra: Inside the Daimler Truck observability stack
In order for fleet managers at Daimler Truck to manage the day-to-day operations of their vast connected vehicles service, they use tb.lx, a digital product studio that delivers near real-time data along with valuable insights for their networks of trucks and buses around the world. Each connected vehicle utilizes the cTP, an installed piece of technology that generates a small mountain of telemetry data, including speed, GPS position, acceleration values, braking force and more.
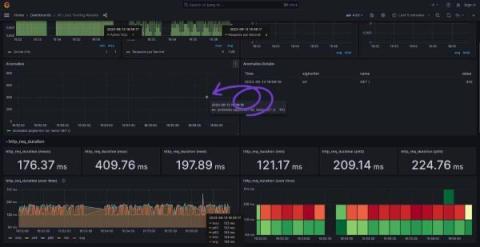
Better anomaly detection in system observability and performance testing with Grafana k6
Grzegorz Piechnik is a performance engineer who runs his own blog, creates YouTube videos, and develops open source tools. He is also a k6 Champion. You can follow him here. From the beginning of my career in IT, I was taught to automate every repeatable aspect of my work. When it came to performance testing and system observability, there was always one thing that bothered me: the lack of automation. When I entered projects, I encountered either technological barriers or budgetary constraints.


