Dashboards
Distributed tracing with Grafana Cloud k6 (Grafana Office Hours #14)
Prometheus Dashboards
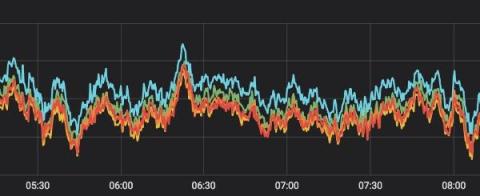
Prometheus is a very popular open-source monitoring and alerting toolkit originally built in 2012. Its main focus is to provide valid insight into system performance by providing a way for certain variables of that system to be monitored. Prometheus displays the performance of these variables as a graph to allow its users to see their system’s performance at a glance.
Unify and query private network data in Grafana Cloud: Private Data Source Connect is now GA
You may be ready to make the move to Grafana Cloud, but securely querying private data has been a blocker. If you wanted to query a network-secured data source like a MySQL database or an Elasticsearch cluster that is hosted in an on-premises private network or a Virtual Private Cloud (VPC), you needed to open your network to inbound queries from a range of IP addresses.
How to securely send your telemetry to Grafana Cloud using AWS PrivateLink
Using Grafana Cloud to manage and monitor even your most sensitive data from your AWS services just got easier. If your organization’s workloads are hosted in AWS and you are using a Grafana Cloud instance that’s also hosted in AWS, you can now use AWS PrivateLink to establish a secure connection between your virtual private cloud (VPC) network and Grafana Cloud for all your data.
AWS PrivateLink for Grafana Cloud
Our Favorite Grafana Dashboards
Grafana is an open-source visualization and analytics tool that lets you query, graph, and alert on your time series metrics no matter where they are stored - Grafana dashboards provide telling insight into your organization. All data from Grafana Dashboards can be queried and presented with different types of panels ranging from time-series graphs and single stats displays to histograms, heat maps, and many more.
The Single Pane of Glass in Modern Observability
Recently I caught up with Jamie Allen on Episode 67 of the Slight Reliability podcast to discuss the idea of a single pane of glass (SPOG). Jamie had written an article titled The Single Pain of Glass which coincidentally was what I titled Slight Reliability Episode 10. I thought given our shared use of puns and this topic that it was worth a conversation! So, what is a single pane of glass? Is it an idea with practical application? How does it fit into the world of modern observability?
How continuous profiling improved code performance for a new Grafana Loki feature
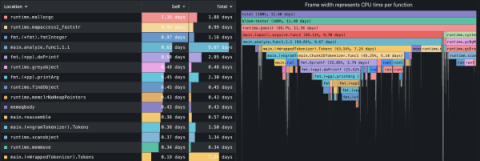
Throughout the software development process, engineers can use a number of methods and tools to ensure their code is efficient. When using Go, for example, there are built-in tools, including those for benchmarking and CPU/memory profiling, to check how efficiently code will run. Engineers can also run unit tests to validate code quality.
Reducing data center carbon emissions with Hardware Sentry, Grafana, and OpenTelemetry
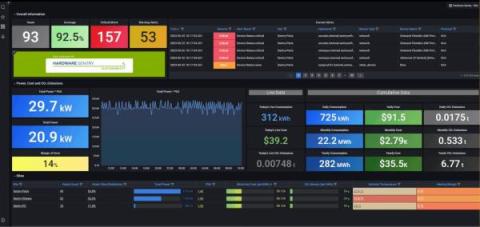
With just 30 employees, Sentry Software might be considered a small company, but they’re prioritizing sustainability in a big way. As the makers of Hardware Sentry, an IT monitoring software, a large part of their business relies on maintaining optimal temperature conditions at their data centers — an operation that contributes to the company’s overall carbon footprint.

