Dashboards
Visualizing MongoDB with Grafana Cloud
Grafana Labs' new AI-powered chatbot
Ask Grot: How we're building a chatbot that's actually helpful on our website
What is Grafana? How do I change the color of a panel set? Where can I find all public dashboards? Who made the Kessel Run in less than 12 parsecs?
Complete Guide To Grafana Dashboards
Grafana is one of the most popular dashboarding and visualization tools for metrics. The Grafana Dashboards are a very important part of infrastructure and application instrumentation. In this post, we will deep dive into Grafana dashboards. We will create a Grafana dashboard for a VM’s most important metrics, learn to create advanced dashboards with filters for multiple instance metrics, import and export dashboards, learn to refresh intervals in dashboards and learn about plugins.
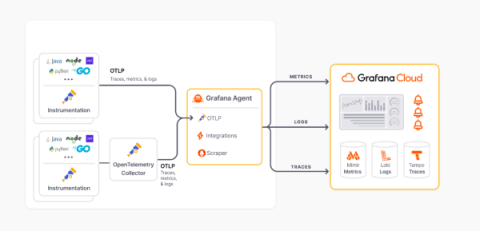
Send Lambda traces to Grafana Cloud with OpenTelemetry
AWS’s serverless technologies are popular because they provide cost effective scaling and great separation of concerns. However, observing serverless architectures like Lambda is challenging due to their transient nature and abstracted infrastructure. Unlike traditional systems with consistent hosts, serverless functions are ephemeral, often scaling rapidly and operating in isolation.
Getting Started with the OpenTelemetry Collector
In the previous article I covered how to set up auto-instrumented tracing for a Node.js app using OpenTelemetry (OTEL). We then sent the spans directly to the open source tracing tool Jaeger. I recommend you give that a read first before walking through this guide because we're going to re-use the instrumentation we set up last time. Today we're going to take things a step further by introducing the OpenTelemetry Collector.
Agentless monitoring for Prometheus in Grafana Cloud (Grafana Office Hours #15)
How to embed Grafana dashboards into web applications
Grafana dashboards are powerful and flexible tools for observing applications and infrastructure, so it’s no surprise we get a lot of questions from the community about how to embed them into their web applications. Over the past few releases, we’ve developed a lot of options for how to do this in Grafana, but there can be confusion about how they work, and when to use each approach.
Grafana Agent v0.37: Feature parity between Static and Flow mode, easy migration configs, and more
Grafana Agent v0.37 is here! This new release brings a lot of exciting new features and marks the pinnacle of a year-long effort to achieve feature parity between Grafana Agent Flow mode and Grafana Agent Static mode. We also extended our config converter to ease the migration from Static to Flow mode and we added the possibility to split your Flow configuration into multiple files. Please make note of some breaking changes in this release.

