Dashboards

Announcing Sift: automated system checks for faster incident response times in Grafana Cloud

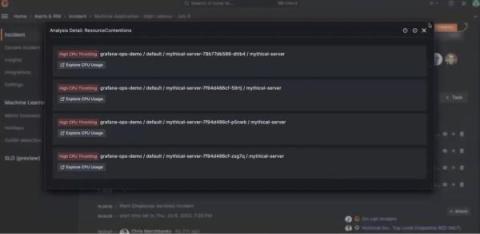
When faced with an incident, there are two areas that demand your immediate attention: the incident investigation, and the cross-functional coordination needed to resolve the issue. Grafana Incident helps with the collaboration by providing a central hub for communication across teams that seamlessly integrates with the tools you are already using, such as Slack or Microsoft Teams. But how can you best use your telemetry data to debug your application and bring your systems back online?

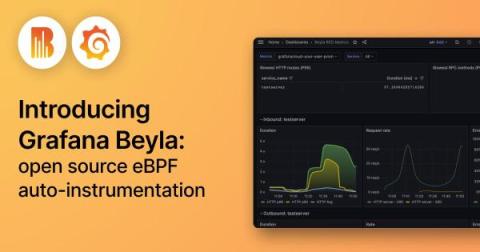
Introducing Grafana Beyla: open source ebpf auto-instrumentation for application observability

Do you want to try Grafana for application observability but don’t have time to adapt your application for it? Often, to properly instrument an app, you have to add a language agent to the deployment or package. And, in languages like Go, proper instrumentation means manually adding tracepoints. Either way, you have to redeploy to your staging or production environment once you’ve added the instrumentation.

Modernizing government documents with Govable and Grafana (Grafana Office Hours #12)

Ari Hershowitz and Andrii Kovalov from Govable.ai talk about modernizing government documents with Govable and Grafana, and how they saved weeks of effort by using Grafana as a ready-made frontend for their clients. They are joined by Developer Advocates Nicole van der Hoeven and Paul Balogh from Grafana Labs.

Grafana Scenes is generally available: start building highly interactive apps today

Grafana Scenes is a frontend library that allows you to effortlessly extend Grafana, enabling capabilities that were once deemed unattainable, or exceedingly challenging, for Grafana app plugin developers. We first introduced Grafana Scenes with the launch of Grafana 10 at GrafanaCON 2023. Now, after 3 months in private preview, we are excited to announce that we are graduating Grafana Scenes to general availability.

How to provision a notification policy in Grafana Alerting - and keep it editable in the UI

Provisioning Grafana Alerting resources, such as notification policies, can help you deploy resources faster and streamline the alerting and notification process. Before getting started, it’s important to understand the different options for provisioning notification policies, how they work, and the challenges they can present. In Grafana Alerting, notification policies use alert labels to determine how alerts are routed to different contact points or receivers.

Grafana Loki hits 20K GitHub stars: 20 fun facts about the open source logging project

The Grafana Loki GitHub repository just hit 20K stars! You can’t exchange GitHub stars for coffee at Starbucks or pay rent with it, but this is a big milestone that is a testament to the enormous momentum of this open source project. Thank you to the Grafana Loki community — this couldn’t have been possible without you! To celebrate this 20K benchmark, here are 20 completely random, but fun facts and tips about Grafana Loki: Interested in learning more about logging?

Grafana k6 for WebSockets and infrastructure testing (Grafana Office Hours #11)

In this episode of Grafana Office Hours, Solution Architect Huzaifa Asif talks about how he has used Grafana k6 for WebSockets and infrastructure testing, and how k6 can be used for general reliability testing in addition to load testing. He is joined by Grafana Labs Developer Advocates Nicole van der Hoeven and Paul Balogh.

Why "good reply game" matters in open source communities

Communities of all sorts, including open source communities, boil down to the daily interactions we have with one another. What we call “the community” emerges from a series of utterances and responses, which gives rise to relationships and networks. This makes “good reply game” essential to create, sustain, and grow an open source community.