Context isn't just for Christmas
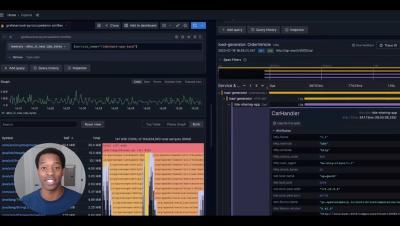
Everyone has their own toys to play with this Christmas, but we all have more fun when we share. The same applies to the tools we use, the data we collect, and the insights we act on. In this video, I'll show you how one of our valued (and definitely real) customers “North Pole Industries” utilizes SquaredUp to share the magic of observability.