Dashboards
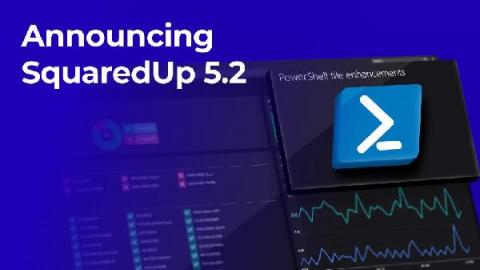
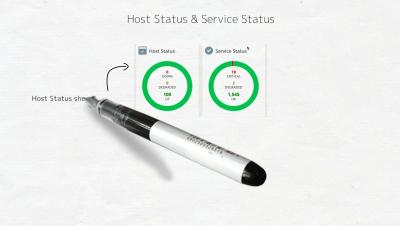
Announcing SquaredUp 5.2
SquaredUp 5.2 is now available! This update brings you enhancements to the PowerShell tile, new Splunk visualizations, various security improvements, and excitingly, a brand new Dashboard Gallery and OpenSource GitHub Samples repository. Keep reading to find out more.
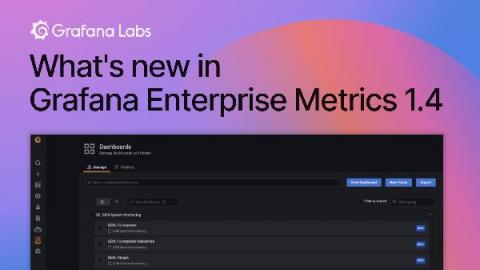
What's new in Grafana Enterprise Metrics 1.4: Cross-cluster query federation and self-monitoring
We introduced Grafana Enterprise Metrics (GEM) last September to give centralized observability teams the ability to provide a multi-tenanted, horizontally scalable Prometheus-as-a-Service experience for their end users. Since then, we’ve continued to make improvements and introduce new functionality. In this blog, I wanted to take a deeper dive into two of the exciting new features released with GEM 1.4.
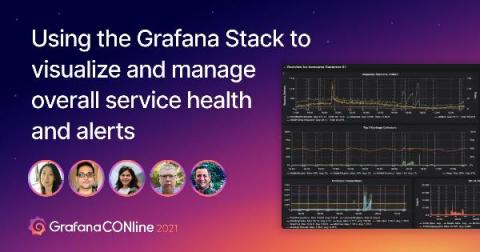
How Salesforce manages service health at scale with Grafana and Prometheus
Cloud-based software company Salesforce is the world’s No. 1 customer relationship management platform (CRM). It helps businesses connect their marketing, sales, commerce, service, and IT teams through one integrated platform.
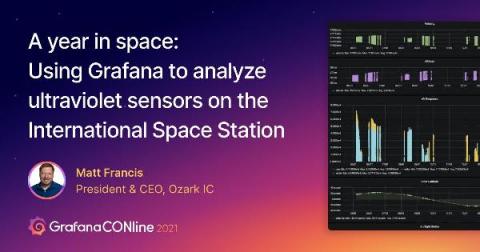
Monitoring UV sensors on the International Space Station with Grafana
In space, there’s no atmosphere to protect against the sun’s ultraviolet radiation. Astronauts in orbit are exposed to the equivalent of eight X-rays a day, and the space stations and suits that protect them degrade over time due to radiation and other factors. Scientists working on the International Space Station (ISS) want to know more about ultraviolet (UV) radiation in orbit so they can design better materials.
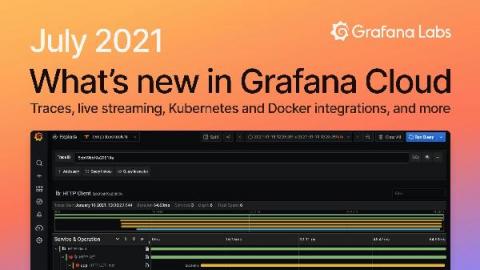
What's new in Grafana Cloud for July 2021: Traces, live streaming, Kubernetes and Docker integrations, and more
If you’re not already familiar with it, Grafana Cloud is the easiest way to get started observing metrics (Prometheus and Graphite), logs (Grafana Loki), traces (Grafana Tempo), and dashboards. Here are the latest features you should know about!
How to quickly find unused metrics and get more value from Grafana Cloud
As the complexity of software systems explodes, so does the amount of data that gets generated by instrumenting these systems. This poses a problem for our users — especially those who are in charge of observability teams and observability platforms at large enterprises. They have to strike the right balance between cost management and giving teams the freedom to instrument whatever they want. Often observability leaders are supporting dozens of teams that are using hundreds of dashboards.
Using Grafana, academics created a next-level dashboard tracking the impact of Covid-19 in Romania
When Covid-19 hit Romania, it was difficult for ordinary citizens to get good information about the pandemic and its escalating impact on the country. The government, presiding over one of the least developed healthcare infrastructures in the European Union, was releasing bulletins via PDF and text that were neither timely nor all that accurate. Into the breach stepped a team of six volunteers—five economists and a data scientist—operating out of Babes-Bolyai University.
Home Dashboard
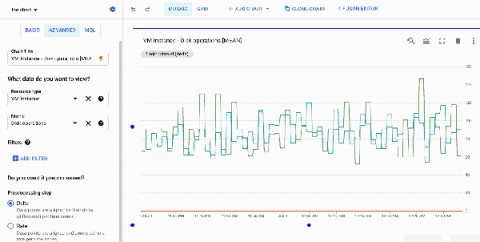
New in the Google Cloud Monitoring data source plugin for Grafana: sample dashboards, deep linking, more
More than two years ago, the Google team began collaborating with Grafana Labs to build a data source plugin for Google Cloud Monitoring (then known as Stackdriver). Today, Grafana ships with built-in support for Google Cloud Monitoring, allowing users to add it as a data source and quickly get started building dashboards for Google Cloud Monitoring metrics. We’ve continued to make improvements on the plugin, and we’ll share in this blog post a few new features we’ve built.


