The latest News and Information on Cloud monitoring, security and related technologies.
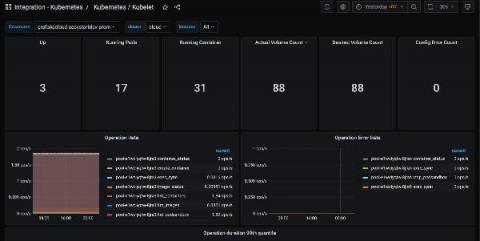
Today we’re excited to introduce the Kubernetes integration for Grafana Cloud, our composable observability platform bringing together metrics, logs, and traces with Grafana. Grafana Cloud users can now easily monitor and alert on core Kubernetes cluster metrics using the Grafana Agent, our lightweight observability data collector optimized for sending metric, log, and trace data to Grafana Cloud.
Knowing how to deploy and run applications has become a key part of modern app development, meaning that developers need expertise in a number of areas beyond their core application code. Whether it’s container orchestration, networking, scaling, or load balancing, there is a steep learning curve to being able to deploy and run an application at scale.
Be aware that we’re not saying that you are in cloud nine, but that you may most likely be using the cloud. That is, if you use Google mail, Microsoft Office 365 office suite or you take a photo with your cell phone and then it gets automatically uploaded to iCloud or something similar, you are using the cloud.
Cloudflare secures and ensures the reliability of your external-facing resources such as websites, APIs, and applications. It protects your internal resources such as behind-the-firewall applications, teams, and devices. This post will show you how Coralogix can provide analytics and insights for your Cloudflare log data – including traffic, performance, and security insights.