Mailchimp
Not subscribed to OpsMatters Newsletter


WALTHAM, Mass., Nov. 3, 2021 — OnPage Corporation, a Boston-based incident management company, today announced the availability of new integrations with leading single sign-on (SSO) solutions Okta and OneLogin. The latest integrations allow for a secure authentication process when users log in to the OnPage system using their SSO account credentials.
If you’re a current user of Agile Requirements Designer (ARD), you are most likely using ARD to design your functional tests. But did you know that you can use ARD to create API tests that can be executed with your test automation framework? In this blog, I’ll share five real use cases for creating API tests with ARD. These examples come directly from our customers, and illustrate how our powerful model-based approach can scale your API testing.
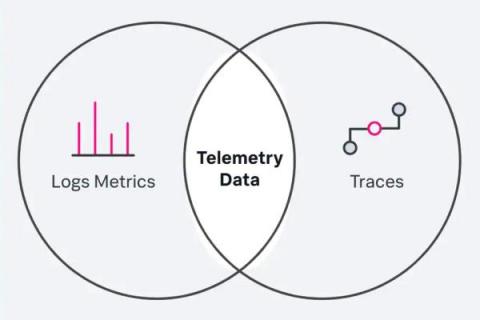
I am honored to be able to talk about Splunk’s investment and commitment to the OpenTelemetry project. I would like to take this opportunity to talk about the latest in the OpenTelemetry community, as well as the instrumentation and data collection distributions available from Splunk. Be sure to read through the whole post, as you will find some roadmap information too!
If your company works with the US Department of Defense (DoD) as a contractor or subcontractor, you will need to prepare to meet CMMC requirements in order to successfully bid on and win contracts. This recent development has been a significant adjustment for small organisations who wish to work with or continue working with the DoD.
This article was written by Nicolas Bohorquez and was originally published in The New Stack. Scroll below for the author’s picture and bio. Telegraf is the preferred way to collect data for InfluxDB. Though in some use cases, client libraries are better, such as when parsing a stream of server-side events. In this tutorial, you’ll learn how to read a data stream, store it as a time series into InfluxDB and run queries over the data using InfluxDB’s JavaScript client library.
The Telegraf 1.20.3 release changed the official Telegraf DockerHub image to no longer run the Telegraf service as root. With this change, the Telegraf service runs with the least amount of privileges in the container to enhance security given the wide extensibility and array of plugins available in Telegraf.
Our November update introduces new team settings and, along with them, entirely new options for escalating Signls. This will allow you to make your incident response even more reliable. One application is to create a ‘managers on duty’ teams with full duty scheduling capabilities and escalate missed Signls to such 2nd level response team. As always, you can find all the details in this article.
Recently, I explored the case for Graylog as an outstanding means of aggregating the specialized training data needed to build a successful, customized artificial intelligence (AI) project. Well, that’s true, of course. My larger point, though, was that Graylog is a powerful and flexible solution applicable to a very broad range of use cases (of which AI development is just one).