Mailchimp
Not subscribed to OpsMatters Newsletter


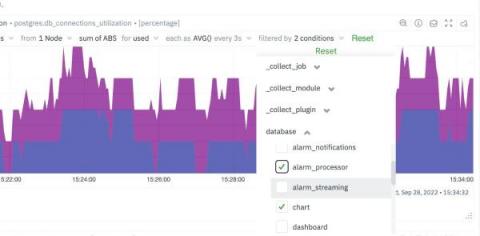
It is sometimes easy to get lost in the mountain of metrics and infinite number of dimensions when working with an infrastructure monitoring tool. Being able to filter metrics by label and visualize only what is relevant to the current scope of monitoring & troubleshooting, becomes absolutely crucial to the success of SREs, Sysadmins and DevOps professionals.
Welcome to the companion post to So You Received an Alert. Now What? Last time, we broke down the process between receiving the Uptime.com check alert and figuring out what broke. Today, we’re going to show you how to communicate your efforts so that everyone – your end users, coworkers, and bosses – know what’s going on. Your first step is to update your Status Page, your central hub for incident management and communication.
When we began the week, we had zero awards from Comparably. As we end the week, we now have a three-peat of awards. Cribl was recognized among 70,000 companies out of 15 million ratings – winning top honors for Happiest Employees, Best Compensation, and Best Perks and Benefits. We’re thrilled to be recognized by Comparably, and we’re looking forward to continuing our pursuit of being the best place to work.
Python web applications are taking over more and more of the internet (source). However, with great Pythonic power comes great responsibility — ensuring that your web applications consistently deliver in terms of performance and reliability. It is one thing to build and ship an application and another to continually monitor and maintain it on the internet.