Operations | Monitoring | ITSM | DevOps | Cloud
Tracing
The latest News and Information on Distributed Tracing and related technologies.
Ask Miss O11y: Making Sense of OpenTelemetry-Context
“What is up with the Context in OpenTelemetry? Why do I need to mess with it at all? Why, when I set a span as active, don’t subsequent spans just use it as a parent?” Oh, yikes, yeah. The Context abstraction in OpenTelemetry is hard to understand. Here are several ways it’s tricky.
How Distributed Tracing Saves Time and Money
In this modern era, most companies want to make customers happy using emerging technologies. This is why they utilize multiple types of tools and new technologies to attract customers in their funnel and finally convert them into leads. However, it has some demerits too.
Usual Performance Suspects: Introducing Suspect Spans
A trace is the end-to-end journey of one or more connected spans and a span is an operation or “work” taking place on a service. So when it comes to debugging a performance issue, being able to pick out slow spans out of a line up is the fastest way to seeing the root cause and knowing how to solve it. Suspect Spans surfaces a list of spans that correspond to where the most time in a transaction is spent.
Ask Miss O11y: Making Sense of OpenTelemetry-Tracer and TracerProvider
OpenTelemetry is a strong standard for instrumentation because it is built of careful, well-thought-out abstractions created by experts in the space. OpenTelemetry feels painful to start using because it’s full of abstractions that make sense to experts in the space. For a developer who wants to think about their own software and not spend a month becoming an expert in telemetry, this is hard. For high-level conceptual description, there’s the OpenTelemetry specification.
How to Configure the Opentelemetry Collector to Begin Collecting Metrics
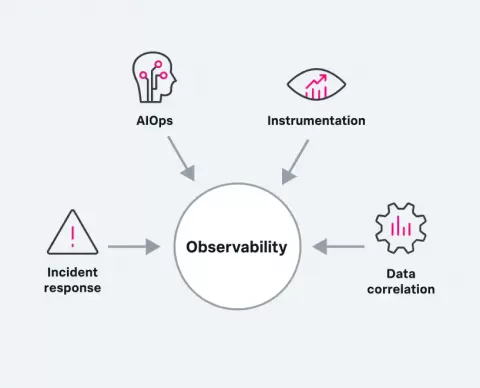
OpenTelemetry enables Observability, and building observable systems requires you to understand the various ways in which they can fail. Jumping from one possible fix to another and one change to another without fully recognizing the impact on the system can be a significant hindrance to a successful customer experience. In this post, I’ll explain how to get started with OpenTelemetry to help you make your systems more observable.
Code coverage for eBPF programs
I bet we all have heard so much about eBPF in recent years. Data shows that eBPF is quickly becoming the first choice for implementing tracing and security applications, and Elastic is also working relentlessly on supercharging our security solutions (and more) with eBPF. However, one major challenge is that the eBPF ecosystem lacks tooling to make developers' lives easier. eBPF programs are written in C but compiled for a specific ISA later executed by the eBPF Virtual Machine.
What is OpenTelemetry and Why is Scout All In?
Before we talk about OpenTelemetry, we should talk about telemetry. Telemetry is: And an instrument is: For the purpose of measuring running computer software and systems, our instruments are virtual instruments. That is to say, code that measures other code. It sounds simple: read a measurement and send it to a remote location. In practice, to make that telemetry data useful in today’s cloud-native and ever more complex environments, there are huge logistical and technical hurdles to overcome.
Configuring OpenTelemetry in Ruby
OpenTelemetry is enabling a revolution in how Observability data is collected and transmitted. See our What Is OpenTelemetry post on why this is an important inflection point in the Observability space. In this post, we’ll walk through how to configure the OpenTelemetry Gems within a Rails app.


