Operations | Monitoring | ITSM | DevOps | Cloud
Tracing
The latest News and Information on Distributed Tracing and related technologies.
Full trace retention search comes to Grafana Cloud
This week we have turned on full trace retention search (beta) in Grafana Cloud Traces. This feature was also introduced in the recent release of Grafana Tempo v1.3. Previously, if you brought up your Grafana Cloud Traces data source, you were greeted with this message: This message simply warned the user that the Grafana Tempo search was calibrated for recent traces only, regardless of the selected time window.
Distributed Tracing 101
The boom of digital commerce is making all businesses take a closer look at how they deliver great customer experiences. To stay competitive, businesses today are using cloud-native architectures, because the cloud-native applications they produce deploy quickly and better support the continuous improvement cycles of agile methodology. Behind the practicality of keeping online customers happy are distributed cloud environments that business applications use for each customer interaction.
Monitoring GraphQL APIs with OpenTelemetry
Honeycomb OpenTelemetry Distro for Java reaches 1.0 release
Today, the Honeycomb OpenTelemetry Distribution for Java reaches a major milestone with a 1.0 release. This is the first Honeycomb OTel Distro to come out of beta and go into the general release category, and you can expect more to come!
What is Distributed Tracing?
Unified Serverless Observability With OpenTelemetry and StackState v4.6
StackState has always believed in the importance of open source and open standards, and we’ve demonstrated our commitment through ongoing support of open technologies. From the beginning, StackState supported StatsD and OpenMetrics. Even our agent is open source, designed to help organizations easily onboard our platform and to give them an extensible open way to observe their services. StackState is now proud to announce our next big open source step.
Why is Distributed Tracing in Microservices needed?
startSpan vs. startActiveSpan
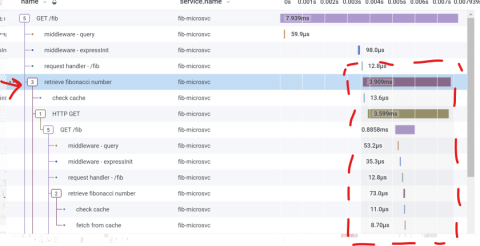
TL;DR: startSpan is easier and measures a duration. Use it if your work won’t create any subspans. startActiveSpan requires that you pass a callback for the work in the span, and then any spans created during that work will be children of this active span. I’m instrumenting a Node.js app with OpenTelemetry, and adding some custom instrumentation. For this important activity that I’m doing (let’s call it “retrieve number”), I’m creating a custom span.
Real-time distributed tracing for .NET Lambda functions
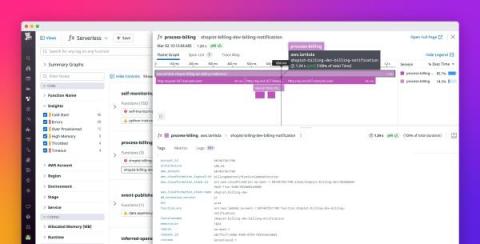
In 2020 we released distributed tracing for AWS Lambda functions written in Python, Node.js, and Ruby, providing you with health and performance insights across your serverless applications. Since then, we’ve expanded our support to additional Lambda runtimes such as Java and Go, and are pleased to announce that real-time distributed tracing is now also available for.NET Lambda functions.


