Operations | Monitoring | ITSM | DevOps | Cloud

Tracing

The latest News and Information on Distributed Tracing and related technologies.

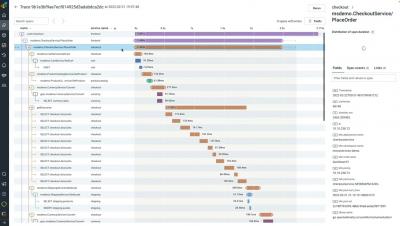
Queryless vs. Query-less. Faster Insights and Better Observer Experience with Span Analytics

In one of my previous blogs I explained how important it is for a modern observability platform to provide “the observers” full, flexible access to all raw telemetry. Observability’s promise to find unknown unknowns relied directly on the ability of fast, powerful and multidimensional high-cardinality analysis of raw data, to uncover previously unknown patterns that have not yet been visualized as a metric, dashboard panel or an alert or anomaly event.

The Ops Agent is now GA and it leverages OpenTelemetry

Running and troubleshooting production services requires deep visibility into your applications and infrastructure. While basic logs and metrics are available out of the box with Google Cloud Compute Engine (GCE), capturing advanced data used to require the installation of both a metrics agent and a logging agent.

An Introduction to OpenTelemetry

The growth of technology has led to more efficient and relevant digital experiences, and customers continue to expect more out of those interactions. That’s true no matter their location and no matter which device they choose to use. Companies that cannot provide these kinds of personalized interactions for their customers find themselves falling behind the competition as technology continues to advance.

How Slack Transformed Their CI With Tracing

Slack experienced meteoric growth between 2017 and 2020—but that level of growth came with growing pains. In his talk at the 2021 o11ycon+hnycon, Frank Chen (LinkedIn), a Slack Senior Staff Engineer, detailed one of Slack’s biggest pain points in that period: flaky tests. A flaky test returns both a passing and failing result despite no changes in the code. At one point, between 2017 and 2020, Slack’s flaky test rate reached as high as 50%.

What's new in Grafana Cloud for July 2021: Traces, live streaming, Kubernetes and Docker integrations, and more

If you’re not already familiar with it, Grafana Cloud is the easiest way to get started observing metrics (Prometheus and Graphite), logs (Grafana Loki), traces (Grafana Tempo), and dashboards. Here are the latest features you should know about!

Distributed Tracing for Kafka Clients with OpenTelemetry and Splunk APM

This blog series is focused on observability into Kafka based applications. In the previous blogs, we discussed the key performance metrics to monitor different Kafka components in "Monitoring Kafka Performance with Splunk" and how to collect performance metrics using OpenTelemetry in "Collecting Kafka Performance Metrics with OpenTelemetry." In this blog, we'll cover how to enable distributed tracing for Kafka clients with OpenTelemetry and Splunk APM.

Tracing the Path to Clear Visibility in DevOps

Today, we’re excited to announce enhancements to the VMware Tanzu Observability by Wavefront platform, which helps teams scale their observability practices and shorten the feedback loops between development and operations. The new features give more flexibility and functionality to any open source investments; help operations, development, and SRE teams resolve problems faster; and extend observability more efficiently into DevOps workflows. Here’s a quick rundown of what’s new.

OpenTelemetry, Not Just for Production Troubleshooting

OpenTelemetry, Not Just for Production Troubleshooting: How to Prevent Downtime as Early as Local Dev OpenTelemetry is a great tool for observability and debugging in production. It provides you with data that empowers understanding of what is slow or broken, as well as what you can do to fix problems that occur in production. But what if you could leverage those same OpenTelemetry capabilities in pre-production? What if you could use those capabilities during development and testing phases to proactively prevent downtime in production?