Operations | Monitoring | ITSM | DevOps | Cloud

Tracing

The latest News and Information on Distributed Tracing and related technologies.

OpenTracing vs. OpenTelemetry

Monitoring and observability have increased with software applications moving from monolithic to distributed microservice architectures. While observability and application monitoring share similar definitions, they also have some differences. The purpose of both monitoring and observability is to find issues in an application. However, monitoring aims to capture already known issues and display them on a dashboard to understand their root cause and the time they occurred.

Rust - Implementing OpenTelemetry in a Rust application for performance monitoring

In this tutorial, we will use OpenTelemetry to instrument a PHP application for telemetry data. OpenTelemetry can be used to trace Rust applications for performance issues and bugs. OpenTelemetry is an open-source project under the Cloud Native Computing Foundation (CNCF) that aims to standardize the generation and collection of telemetry data. Telemetry data includes logs, metrics, and traces. More about SigNoz.

How to monitor Elasticsearch with OpenTelemetry

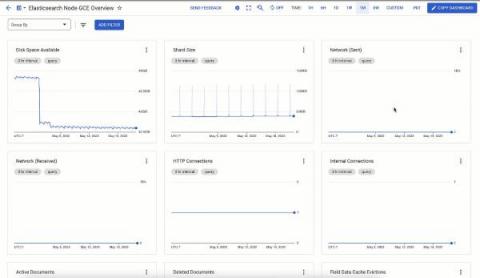
Some popular monitoring tools in the market can complicate and create blind spots in your Elasticsearch monitoring. That’s why we made monitoring Elasticsearch simple, straightforward and actionable. Read along as we dive into the steps to monitor Elasticsearch using observIQ’s distribution of the OpenTelemetry collector. To monitor Elasticsearch we will configure two OpenTelemetry receivers, the elasticsearch receiver and the JVM receiver.

Installing and Configuring the OpenTelemetry Collector

The scope of the OpenTelemetry project encompasses how telemetry data is collected, processed, and transmitted. The OpenTelemetry project is not involved with how the data is stored, displayed, or used beyond the collection and transmission phases. The OpenTelemetry Collector is an application written in Go.

Implementing OpenTelemetry in React applications | Tutorial

More about SigNoz: SigNoz - Monitor your applications and troubleshoot problems in your deployed applications, an open-source alternative to DataDog, New Relic, etc. Backed by Y Combinator. SigNoz helps developers monitor applications and troubleshoot problems in their deployed applications. SigNoz uses distributed tracing to gain visibility into your software stack. If you need any clarification or find something missing, feel free to raise a GitHub issue with the label documentation or reach out to us at the community slack channel.

OpenTelemetry PHP | Monitoring a PHP application with OpenTelemetry

PHP is a widely popular server-side language and enjoys the top spot in terms of market share. Many world-famous organizations like Facebook have their applications written in PHP. WordPress, which powers 43% of all websites, is also built on PHP. In this tutorial, we will use OpenTelemetry to instrument a PHP application for telemetry data. It’s essential to monitor your PHP application for performance issues and bugs.

Introducing the Mezmo Exporter for OpenTelemetry

At Mezmo, we see a massive opportunity to reduce Mean Time to Detection (MTTD) and Mean Time to Resolution (MTTR) by making log data more valuable and actionable. Today, we’re thrilled to announce the release of the Mezmo Exporter for OpenTelemetry- the first step in our continued work with the project to further simplify the ingestion of log data and make that data more actionable with enrichment of key OpenTelemetry attributes.

Tracing errors and surfacing collateral damage across your code base

Frontend technologies typically talk to several services in your backend, and those services talk to other services. At the root of every issue is a single event that causes a domino effect. A domino effect that impacts every operation from the first experience on the frontend to the backend API call. Sentry can show you how these exceptions and latency issues impact every one of your services. For example, take the ever common and seemingly simple to resolve 500 - Internal Server Error.