Operations | Monitoring | ITSM | DevOps | Cloud
Tracing
The latest News and Information on Distributed Tracing and related technologies.
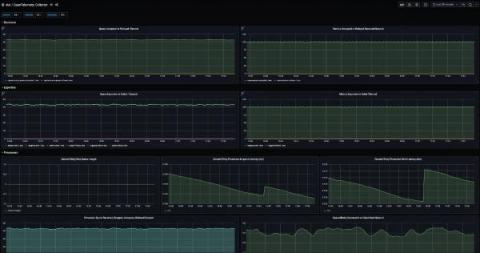
How to collect Prometheus metrics with the OpenTelemetry Collector and Grafana
OpenTelemetry is a set of APIs, SDKs, tooling, and integrations that are designed for the creation and management of telemetry data such as traces, metrics, and logs. One of the main components of OpenTelemetry, or OTel for short, is the OpenTelemetry Collector. The OpenTelemetry Collector, or Otel Collector, is a vendor-agnostic proxy that can receive, process, and export telemetry data.
What Is Telemetry and Why Is It Important?
Properly leveraging telemetry is a true game-changer for any IT department looking to optimize and stabilize its systems. Telemetry provides the first step to answering the all-important question, “What’s happening in my network?” It’s your eye into the inner workings of your system, giving you a view into how different components are performing.
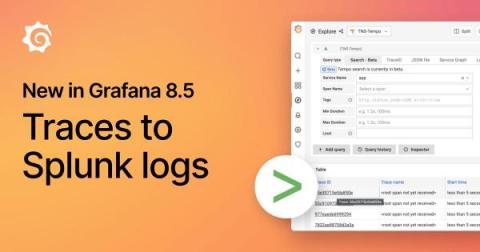
New in Grafana 8.5: How to jump from traces to Splunk logs
The recent release of Grafana 8.5 marks the start of enabling the jump from traces directly to Splunk logs. It’s a big leap that now allows you to draw a straight line between your traces — whether they are coming from Tempo, Zipkin, or Jaeger — to even more third-party logging data, all from the comfort of your traces view. Previously, the Grafana trace to logs enablement included only Loki logs.
Instrumenting Your Custom Application Code with OpenTelemetry
Application Monitoring, or Application Tracing, is an important piece of Observability within your application and stack. Application tracing involves installing an API and/or SDK in your application which then instruments, or wraps your application code with other code that measures the time spent in certain areas of your code, and adds important contextual information to the traces.
How to capture Spring Boot metrics with the OpenTelemetry Java Instrumentation Agent
In a previous blog post, Adam Quan presented a great introduction to setting up observability for a Spring Boot application. For metrics, Adam used the Prometheus Java Client library and showed how to link metrics and traces using exemplars. However, the Prometheus Java Client library is not the only way to get metrics out of a Spring Boot app. One alternative is to use the OpenTelemetry Java instrumentation agent for exposing Spring’s metrics directly in OpenTelemetry format.
How to Monitor Riak Metrics with OpenTelemetry
Design choices in ingesting 1 million events/s using Opentelemetry and SigNoz
Elastic Observability 8.2: Tail-based sampling, plus more serverless visibility for AWS
As more organizations adopt cloud-native technologies and microservices-based architectures, application troubleshooting is becoming increasingly complex. With so many moving parts in an environment that is both dynamic and distributed, it is difficult to get the full picture. Yet complete visibility is crucial in order to find and fix issues quickly — especially ones that impact the bottom line.
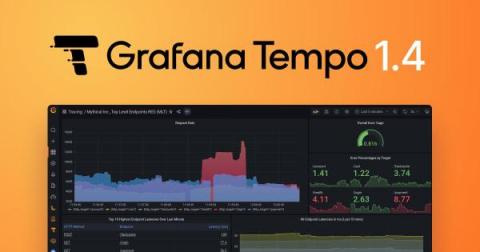
New in Grafana Tempo 1.4: Introducing the metrics generator
Grafana Tempo 1.4 has been released and features a new optional component: metrics generator, which automatically generates RED metrics and service graphs from your traces. We’re actively rolling out the metrics-generator service to our own Grafana Cloud offering and are looking for Grafana Cloud Traces customers wanting early access. If interested, you can email our support team for more details.


