

Cookdown Discovery Regular Expressions Explained
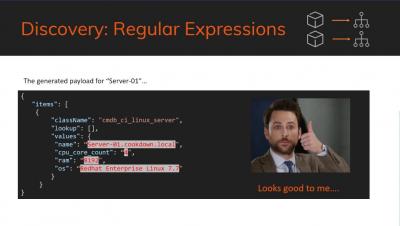
From Cookdown Discovery 1.5, regular expressions (RegEx) can be used to shape the data from SCOM before pushing it up into ServiceNow. This video will show you how it all works and explain where it could come in handy


