In different techniques, entities and relationships remain central. However, their nature and roles are reinterpreted according to the business goals. Data modeling is the process of defining and representing the data elements in a system in order to communicate connections between data points and structures. In his impactful book “Designing Data-Intensive Applications,” Martin Kleppmann describes data modeling as the most critical step in developing any information system.
As organizations grow, the number of tools needed for basic business operations grow with it. Unfortunately, as you add more tools to an organization, you increase the number of potential attack vectors. Within the National Vulnerability Database (NVD), there were 26,448 CVEs published last year, an increase of 20% over 2021. Each of these vulnerabilities serve as opportunities for bad actors to break their way into your network, leading to a loss of valuable data, money, and time.
Canonical is happy to announce that Charmed Kubeflow 1.7 is now available in Beta. Kubeflow is a foundational part of the MLOps ecosystem that has been evolving over the years. With Charmed Kubeflow 1.7, users benefit from the ability to run serverless workloads and perform model inference regardless of the machine learning framework they use.
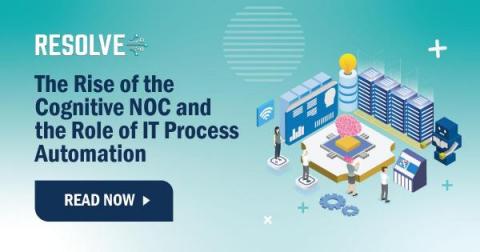
Today’s Cognitive Network Operations Center (Cognitive NOC) is a significant advancement that employs artificial Intelligence (AI) and machine learning (ML) to dramatically modernize and improve network management and operations. Working together, the NOC and IT Process Automation (ITPA) propel superior efficiency and effectiveness of network operations, minimize downtime, lower operational costs, and overcome additional challenges in optimizing network performance.
So far in this series, I’ve outlined how a scaling enterprise’s accumulation of data (data gravity) struggles against three consistent forces: cost, performance, and reliability. This struggle changes an enterprise; this is “digital transformation,” affecting everything from how business domains are represented in IT to software architectures, development and deployment models, and even personnel structures.
Google Cloud provides its own set of metrics for monitoring applications, services, and instances. There are a huge number of metrics – more than 1,500 different ones just for GCP monitoring! While this is great, dealing with such a number can also be overwhelming. Filtering, pulling, exploring, and storing the metrics that you really need can be an enormously time-consuming task, and a big challenge.