A new year with a new look and many more...
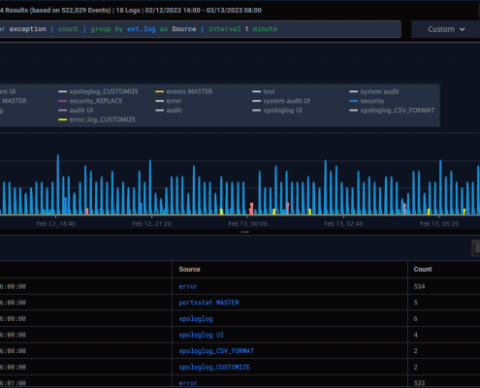
Simplified analysis. Enhanced visualizations, alerting capabilities, advanced data forwarding, and more. Great news! We have published a new update with many exciting new features and optimizations.


Simplified analysis. Enhanced visualizations, alerting capabilities, advanced data forwarding, and more. Great news! We have published a new update with many exciting new features and optimizations.
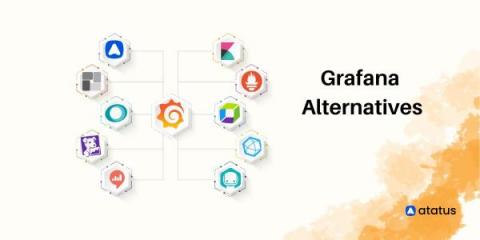
Grafana is a powerful open-source data visualization platform created by Torkel Ödegaard in 2014. With its front-end written in Typescript and a Golang back-end, this data monitoring platform allows users to create and share interactive and dynamic dashboards with custom charts and panels using data from various sources, including InfluxDB, Prometheus, Elasticsearch, and many others. Template variables are also available as dropdown options to create dynamic and reusable dashboards.
The year was 1995. Michael Jordan returned to the NBA. Amazon sold its first book. Windows 95 unleashed the era of taskbars, long filenames, and the recycle bin. And when people weren’t dancing the Macarena, they were flocking to see Apollo 13 and hear Tom Hanks utter the phrase that would launch millions of (mostly annoying) impersonations: “Houston, we have a problem.”
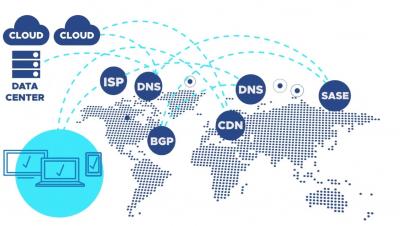
Cloud networking is the IT infrastructure necessary to host or interact with applications and services in public or private clouds, typically via the internet. It’s an umbrella term for the devices and strategies that connect all variations of on-premise, edge, and cloud-based services.
Third-party JavaScript libraries provide developers with the tools they need to build modern web experiences, and a bit of cheatcode at times to not have to start from scratch. I mean, you don’t want to build an entire monitoring solution, so we help with Sentry’s Next.js SDK that only requires a couple of lines of code.