Operations | Monitoring | ITSM | DevOps | Cloud

Dashboards

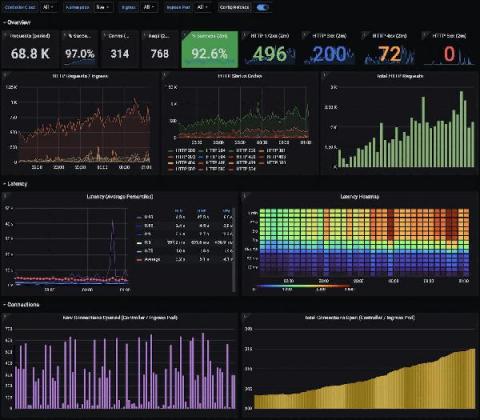
Announcing new features for Cloud Monitoring's Grafana plugin

The observability of metrics is a key factor for a successful operations team, allowing for increasingly effective visualizations, analysis, and troubleshooting. Google Cloud works with third-party partners, such as Grafana Labs, to make it easy for customers to create their desired observability stack leveraging a combination of different tools. More than two years ago, we collaborated with Grafana Labs to introduce the Cloud Monitoring plugin for Grafana.

New in Grafana Enterprise 8.0: Fine-grained access control for reporting and user management

From early on, Grafana has managed access control with three organizational permission levels (Viewer, Editor, and Admin) and one special global permission level of Grafana Admin. There are also configuration file options that can be globally applied to all users in an organization within an instance, as well as data source permissions and dashboard permissions.

Grafana dashboard showcase: Visualizations for Prometheus, home energy usage, GitHub, and more!

The Grafana community is one of the most vibrant in all of web development. And to celebrate the conclusion of GrafanCONline, the launch of Grafana 8 and Tempo 1.0, and so much more, we’re pleased to share this dashboard showcase. (And in case you missed any of the great sessions at GrafanaCONline, the videos are available on demand now!) Each of these 12 dashboards was built by our community, for our community.

New in Kibana: How we made it easier to manage visualizations and build dashboards

Our Kibana team has been hard at work implementing and executing on a new Kibana strategic vision to streamline the dashboard creation process and sand down the rough edges of creating visualizations for dashboards. We accomplished our goal and reduced the overall time it takes users to go from a blank slate to a meaningful dashboard that conveys insights about the data.

Why Dashboards Are Not Enough to Proactively Monitor Your Business

How much is your company losing by reacting to problems after they’ve had a negative impact on your bottom line? How many customers churn in the time it takes you to notice complaints to your call center? Proactive business monitoring allows you to detect incidents before they have a negative impact on your company’s revenue and reputation.

GrafanaCONline Day 6 recap: The latest on Loki for logs, Grafana for monitoring high performance computing, the business of Grafana Labs, and more!

GrafanaCONline 2021 has ended! Thank you to everyone who tuned in and to all of our presenters. If you’d like to relive any moment, it’s not too late to sign up to get notified about on-demand access to all the session recordings, which will be available soon. If you didn’t get a chance to watch Thursday’s presentations, here’s what you missed from Day 6 of the conference.

GrafanaCONline 2021 Day 5 recap: Grafana alerting, dashboards as code, synthetic monitoring in Grafana Cloud, and more!

GrafanaCONline 2021 is still going strong and you can tune in live (for free!) or sign up to get notified about on-demand access to all the session recordings, which will be available after GrafanaCONline ends. Here’s what you missed on Day 5 of the conference.