Operations | Monitoring | ITSM | DevOps | Cloud

Dashboards

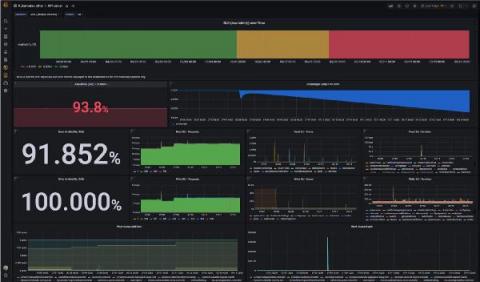
How Grafana helps organizations manage SLOs across multiple monitoring data sources

“SLO is a favorite word of SREs,” Grafana Labs Principal Software Engineer Björn “Beorn” Rabenstein said during his talk at KubeCon + CloudNativeCon NA 2019. “Of course, it’s also great for design decisions, to set the right goals, and to set alerting in the right way. It’s everything that is good.” So what happens when things go bad?

Grafana Labs welcomes the Pace.dev team, experts in building tools with great developer experience

As we look to the future of Grafana Labs and our products, we are keen to expand the ways in which we can help engineering teams build, maintain, and operate great software. We believe we can only achieve this by paying careful attention to the developer experience and the challenges faced in the real world of engineering.

Trending: A Seismic Shift in the Way We Present your Data

Eagle-eyed RapidSpike users will have noticed a big update to the app went live recently, with a major improvement to our Page Overview dashboard . Going back to September 2020, when we launched “RapidSpike Version 2” , we had great plans for the Page Overview – but they never quite materialised. Team efforts were focussed elsewhere and we did little to improve the old Page Overview or the data we displayed.

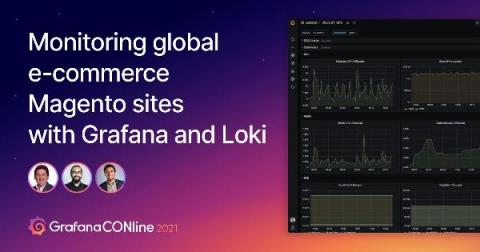
How Pernod Ricard uses Grafana and Loki to scale and monitor its global e-commerce business

Pernod Ricard is the toast of the wine and spirits industry, with a comprehensive portfolio that includes brands such as Jameson, Absolut Vodka, and Havana Club. While the $53 billion company has thrived on traditional distribution channels such as restaurants, clubs, stores, and duty-free shops, Pernod Ricard has recently focused on growing its direct-to-consumer (D2C) e-commerce business.

Dashboarding Enterprise IT Tools with PowerShell

SquaredUp’s PowerShell visualizations provide limitless extensibility when it comes to visualizing your data. You can connect, manipulate, correlate, calculate, and visualize any data set from any tool into compelling metrics; but did you know you can also load third party PowerShell modules, compare metrics from SCOM and other data sources on the fly, visualize log files, connect to any database, and much more?

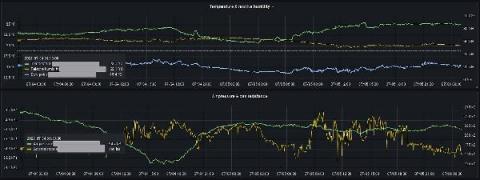
IoT at your home, work, or data center with Prometheus metrics and Grafana Cloud

We recently had a hackathon at Grafana Labs. Anyone who wanted could get several work days without normal responsibilities to do whatever they found meaningful in the wider Grafana community and/or Grafana Labs commercial offerings. This allowed me to invest some time into Kraken, a project designed for reading out different sensors, and to update it for modern hardware and libraries.

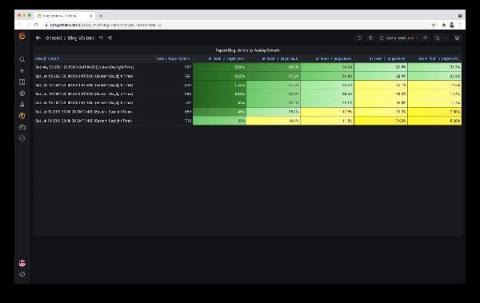
How to visualize your business performance with cohort tables using Grafana and BigQuery

Grafana presents some of the most versatile tools for visualizing and understanding the real-time performance and reliability of systems, regardless of where your data lives. But one question our customers frequently ask is, “Can I use Grafana to understand the health and performance of my business?” More often than not, our answer is yes.