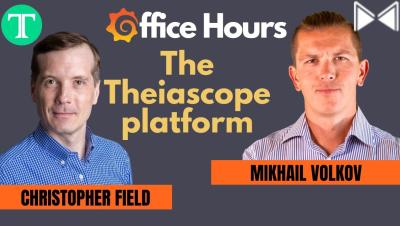
Operations | Monitoring | ITSM | DevOps | Cloud

ObservabilityCON 2023 - Opening Keynote (Live)

👋 Coming to you live from London, Grafana ObservabilityCON 2023's keynote introduces the latest developments in the open and composable LGTM (Loki, Grafana, Tempo, Mimir) observability stack AND many exciting announcements! Our keynote features CEO/Co-founder Raj Dutt, CTO Tom Wilkie, and members of the Grafana Labs engineering team.

Managing observability spend with Grafana Cloud's Cost Management Hub

Learn how Grafana Cloud helps analyze, manage and optimize observability spend from a central location called the cost management hub. The move to cloud-native architectures like K8s and Prometheus has caused an unprecedented increase in telemetry data that has resulted in observability bills skyrocketing. With Grafana Cloud and the central cost management hub, you will be able to answer any cost-related question with the tools to inspect, attribute, optimize and monitor your observability spend.

How to map log volume to teams with Grafana Cloud's Log Volume Explorer | Demo

Investigate the source of high log volumes in Grafana Cloud by leveraging log labels to understand which teams or applications are responsible for log usage. In this video, see how to use the Log Volume Explorer with a point-and-click user interface and explore log volumes by using any combination of labels associated with the logging data. Slice and dice the data as you choose to see log volume broken down by teams, applications, clusters, cloud region.

Grafana k6 for Beginners: Why observability needs testing

Having observability and monitoring solutions is a great way to gain insights into your applications' health, behavior, and performance. However, it doesn’t prevent incidents. Observability needs a partner, and this is where Grafana k6 can help you! In this video, Marie Cruz, a Developer Advocate at Grafana Labs, explores what Grafana k6 is, why it's the missing puzzle piece in your Grafana stack, and how to get started.

Building Dashboard and Dashboard Inputs in Cribl Search

This video demonstrates how to create “inputs” to Cribl Search dashboards. An Input is a control widget that we can add to our Dashboards to control how they execute. They allow the user to supply a range of inputs to customize one or many of the Searches in each of the panels on a given dashboard.

Load testing on Kubernetes with k6 Private Load Zones (Grafana Office Hours #19)

This week, we're talking about how you can do load testing on Kubernetes with k6 Private Load Zones, a new feature on Grafana Cloud k6 that leverages the k6 Kubernetes operator to allow you to run distributed load tests against applications behind a firewall. Here to discuss this new feature are Senior Software Engineer Olha Yevtushenko, Product Manager Daniel González Lopes, Developer Advocate Paul Balogh, and Senior Developer Advocate Nicole van der Hoeven.