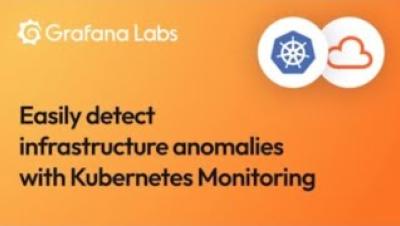
We recently had a hackathon at Grafana Labs. Anyone who wanted could get several work days without normal responsibilities to do whatever they found meaningful in the wider Grafana community and/or Grafana Labs commercial offerings. This allowed me to invest some time into Kraken, a project designed for reading out different sensors, and to update it for modern hardware and libraries.
Grafana presents some of the most versatile tools for visualizing and understanding the real-time performance and reliability of systems, regardless of where your data lives. But one question our customers frequently ask is, “Can I use Grafana to understand the health and performance of my business?” More often than not, our answer is yes.
While unit testing and integration testing can give you insight into the individual functionalities of an application, “at times you need some sort of monitoring or testing mechanism which also simulates a user’s behavior to test how the application would work or look to an actual user in the world,” says Grofers Software Development Engineer Yashvardhan Kukreja. That’s where synthetic monitoring comes in.
We’ve seen the value that many in our community have gotten from using Jira for planning, tracking, and releasing software, so we’re excited to announce the new Jira integration for Grafana Cloud.
There’s stargazing, and then there’s SOFIA. The SOFIA airborne astronomical observatory is a joint NASA and German Aerospace Center endeavor consisting of a modified Boeing 747SP aircraft with a 2.7-meter reflecting telescope and a team of astronomers onboard.
In this guide to the best Kibana dashboards examples around, we wanted to show you some of the most ingenious ways to use Kibana within your organisation to explore a wide range of ways that data and metrics can be centralised from every corner of your organisation.
At Grafana Labs, we use Tanka to deploy workloads to our Kubernetes clusters. As our organization grew, we asked ourselves: How should we manage workload configuration at scale, and in a consistent way?
SquaredUp 5.2 is now available! This update brings you enhancements to the PowerShell tile, new Splunk visualizations, various security improvements, and excitingly, a brand new Dashboard Gallery and OpenSource GitHub Samples repository. Keep reading to find out more.